|

|
|
Monitoring
and Operations Committee Agenda
NOTICE
IS GIVEN that the next meeting of the Monitoring and Operations Committee
will be held in Council Chambers, Regional House, 1 Elizabeth Street,
Tauranga on:
Tuesday
7 March 2023 COMMENCING AT 9.30 am
This meeting will be
livestreamed and recorded.
The Public section of
this meeting will be livestreamed and recorded and uploaded to Bay of Plenty
Regional Council’s website. Further details on this can be found
after the Terms of Reference within the Agenda. Bay of Plenty Regional
Council - YouTube
|
|
Fiona McTavish
Chief Executive, Bay
of Plenty Regional Council Toi Moana
27 February 2023
|
|
Monitoring and Operations Committee
|
Membership
|
Chairperson
|
Cr Kevin Winters
|
|
Deputy Chairperson
|
Cr Ron Scott
|
|
Members
|
All Councillors
|
|
Quorum
|
Seven members,
consisting of half the number of members
|
|
Meeting frequency
|
Quarterly
|
Purpose
·
Oversee and monitor the implementation of policies and
strategies, promoting effective delivery and coordination between policy and
implementation through recommendations to the
Strategy and Policy Committee.
·
Monitor the implementation of
Council’s activities, projects and services.
Role
Oversee and monitor:
·
Regulatory performance of permitted activities, resource consents
and bylaw rules, including compliance and enforcement.
·
Delivery of biodiversity, catchment management and flood
protection activities in the region.
·
Delivery of biosecurity activities, including implementation and
monitoring of the Regional Pest Management Plan.
·
Effectiveness of navigation safety bylaw responses.
·
State of the Environment monitoring.
·
Implementation of specific programmes in place such as the Mount
Maunganui Industrial Air Programme, and integrated catchment programmes (e.g.
Rotorua Lakes and Tauranga Moana).
·
Receive information on environmental monitoring
and performance monitoring trends and recommend to the Strategy and Policy
Committee to inform policy review.
·
Monitor Council’s actions on Climate Change.
·
Operational activities that implement relevant national and
regional plans and strategies, including:
§
Science
§ Flood
protection
§ Biosecurity
§ Catchment
management
§ Rivers
and drainage
§ Compliance,
monitoring and enforcement
§ Resource
consents
§
Maritime
Power
to Act
To make all decisions necessary to fulfil the role and
scope of the committee subject to the limitations imposed.
The Monitoring and Operations
Committee is not delegated authority to:
·
Develop, adopt or review strategic
policy and strategy.
·
Approve Council submissions on
legislation, policy, regulations, standards, plans and other instruments
prepared by Central Government, Local Government and other organisations.
·
Identify, monitor and evaluate
necessary actions by the organisation and other relevant organisations under
co-governance arrangements.
Power
to Recommend
To the Strategy and Policy
Committee on matters necessary for reviewing plans, strategies and policies.
To Council and/or any standing committee as it deems
appropriate.
Recording
of Meetings
Please note the Public section of this
meeting is being recorded and streamed live on Bay of Plenty Regional
Council’s website in accordance with Council's Live Streaming and
Recording of Meetings Protocols which can be viewed on Council’s website.
The recording will be archived and made publicly available on Council's website
within two working days after the meeting on www.boprc.govt.nz for a period of
three years (or as otherwise agreed to by Council).
All care is taken to maintain your privacy;
however, as a visitor in the public gallery or as a participant at the meeting,
your presence may be recorded. By remaining in the public gallery, it is
understood your consent is given if your image is inadvertently broadcast.
Opinions expressed or statements made by
individual persons during a meeting are not the opinions or statements of the
Bay of Plenty Regional Council. Council accepts no liability for any opinions
or statements made during a meeting.
Bay of Plenty
Regional Council - Toi Moana
Governance Commitment
mō te taiao, mō ngā
tāngata - our environment and our people go hand-in-hand.
We provide excellent governance when,
individually and collectively, we:
· Trust and respect each
other
· Stay strategic and
focused
· Are courageous and
challenge the status quo in all we do
· Listen to our
stakeholders and value their input
· Listen to each other to
understand various perspectives
· Act as a team who can
challenge, change and add value
· Continually evaluate what
we do
TREAD LIGHTLY, THINK DEEPLY,
ACT WISELY, SPEAK KINDLY, JOURNEY TOGETHER.
Monitoring
and Operations Committee 7 March 2023
Recommendations in reports are not to be construed as Council policy
until adopted by Council.
Agenda
1. Apologies
2. Public
Forum
3. Items
not on the Agenda
4. Order
of Business
5. Declaration
of Conflicts of Interest
6. Reports
6.1 Chairperson's Report 1
Information Only
6.2 Rates Collection Update 1
6.3 Customer Service
Performance Update 1
6.4 Climate Change Quarterly
Report 1
Attachment 1 - Climate Change
Programme Overview February 2023 1
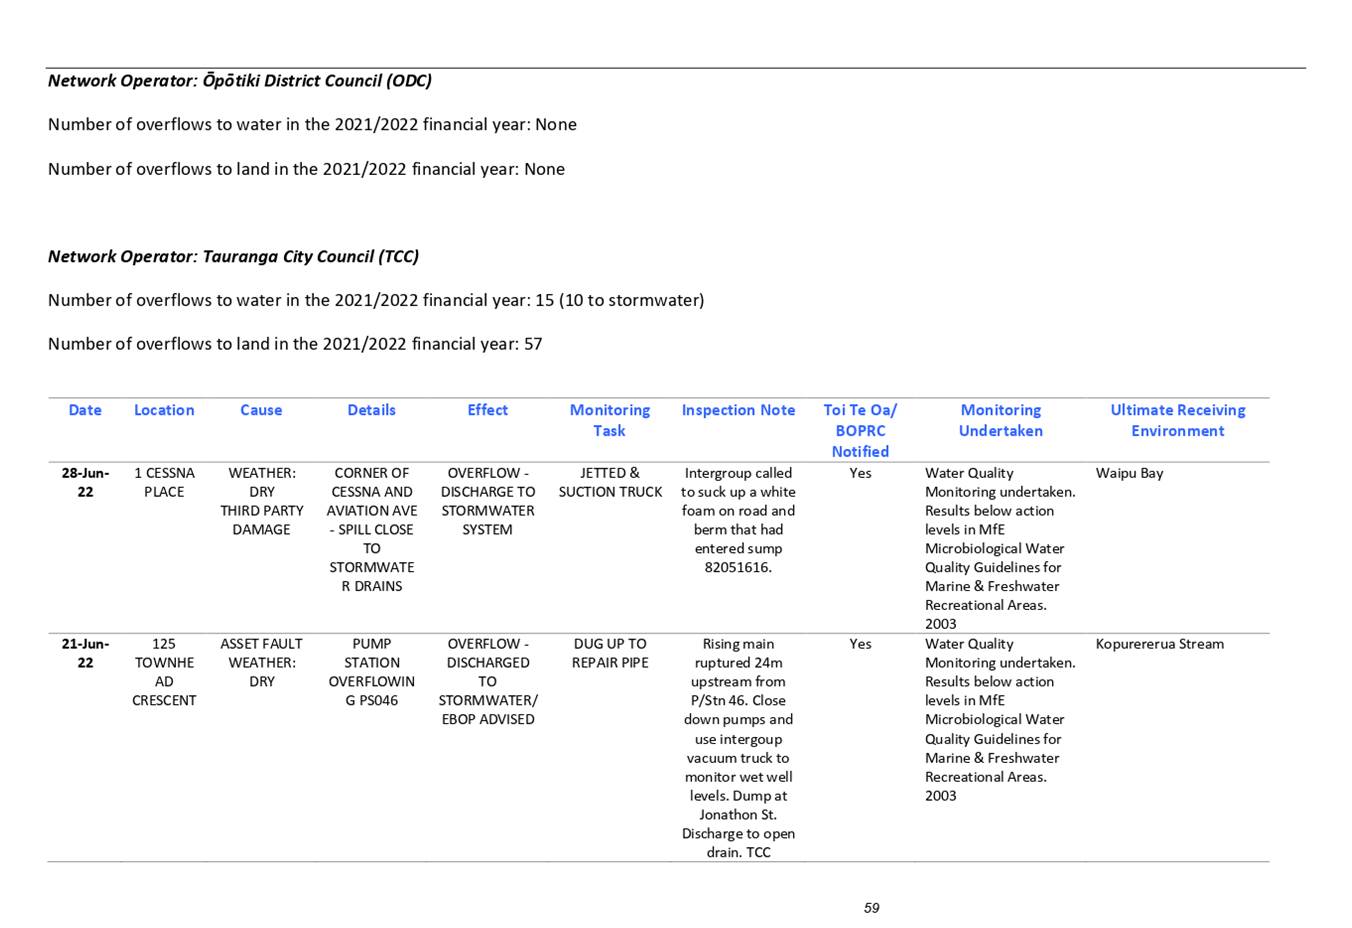
6.5 2021/2022 Compliance
Activity Report 1
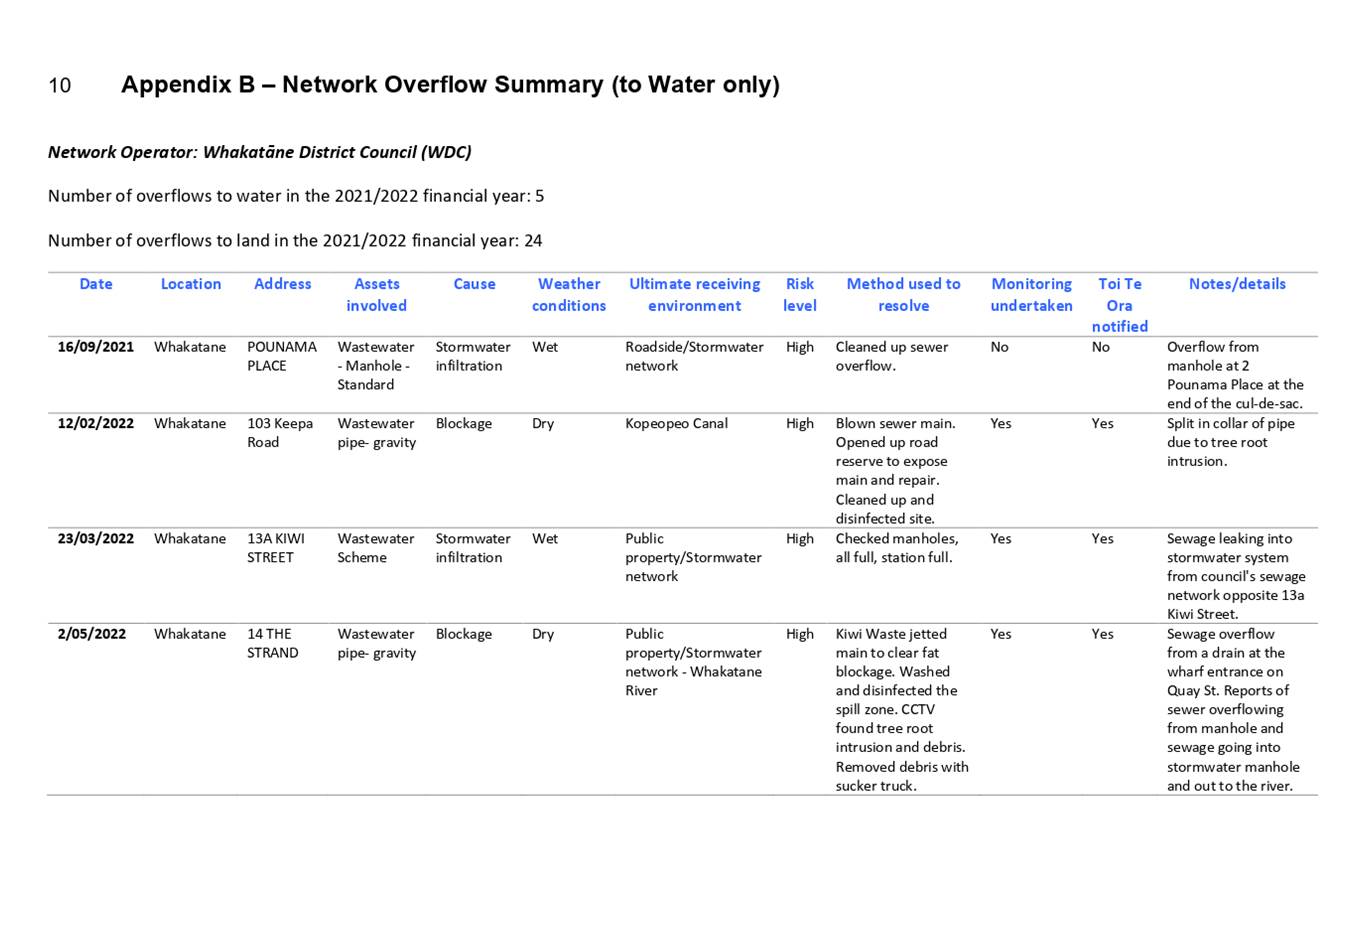
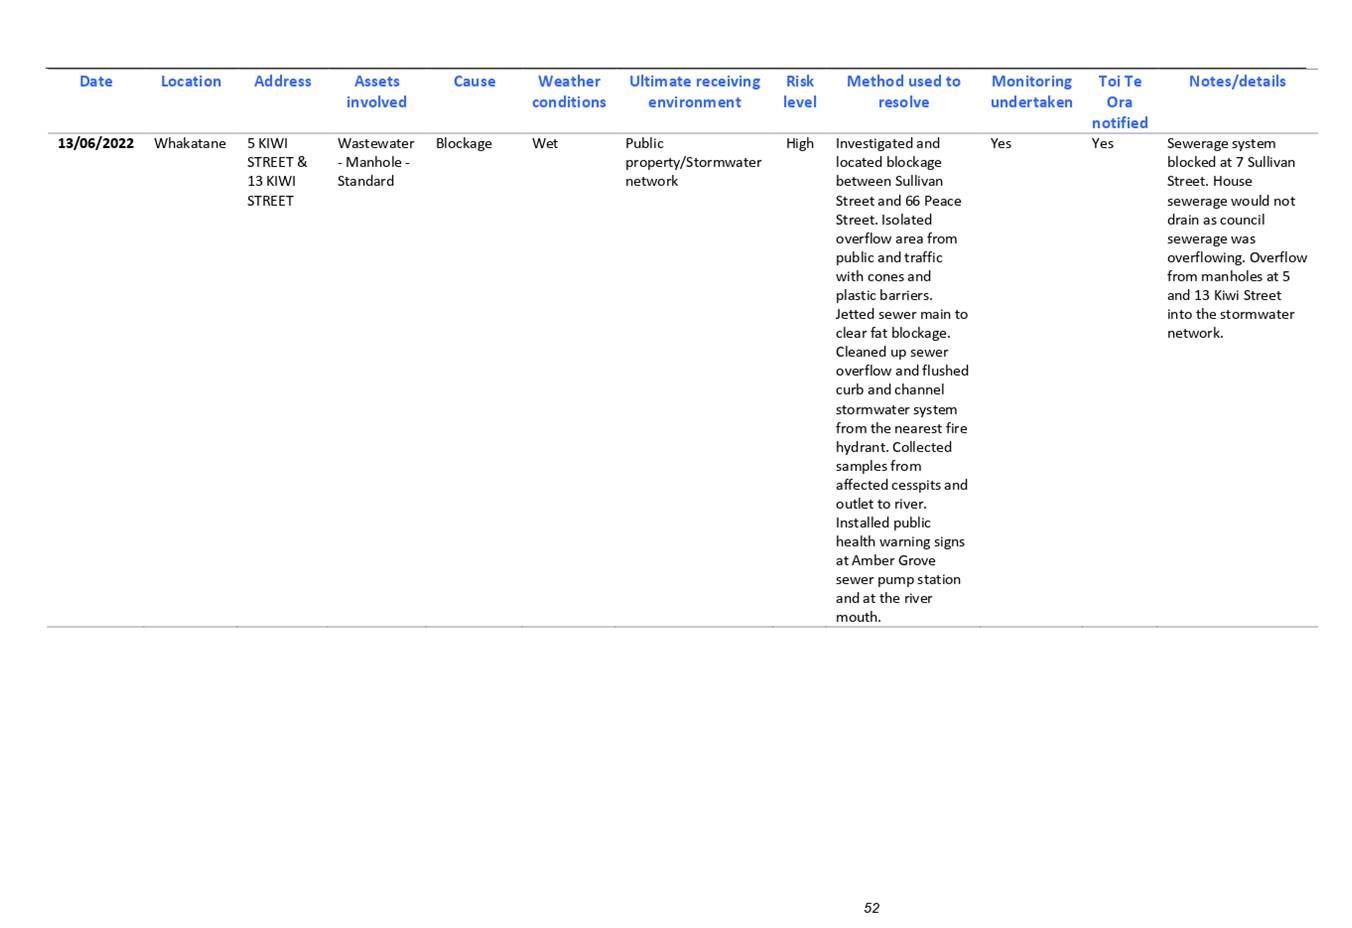
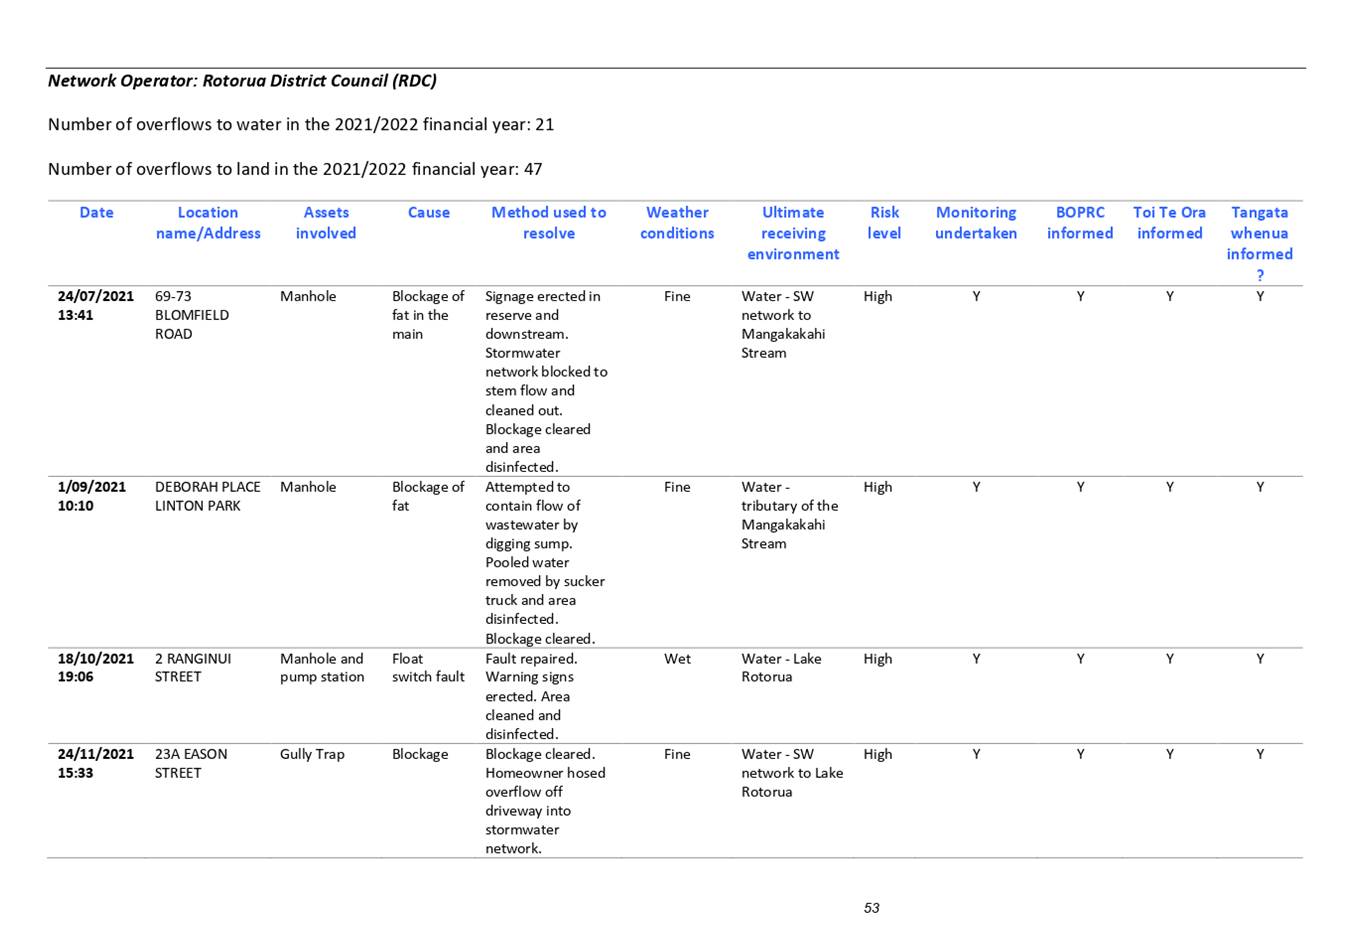
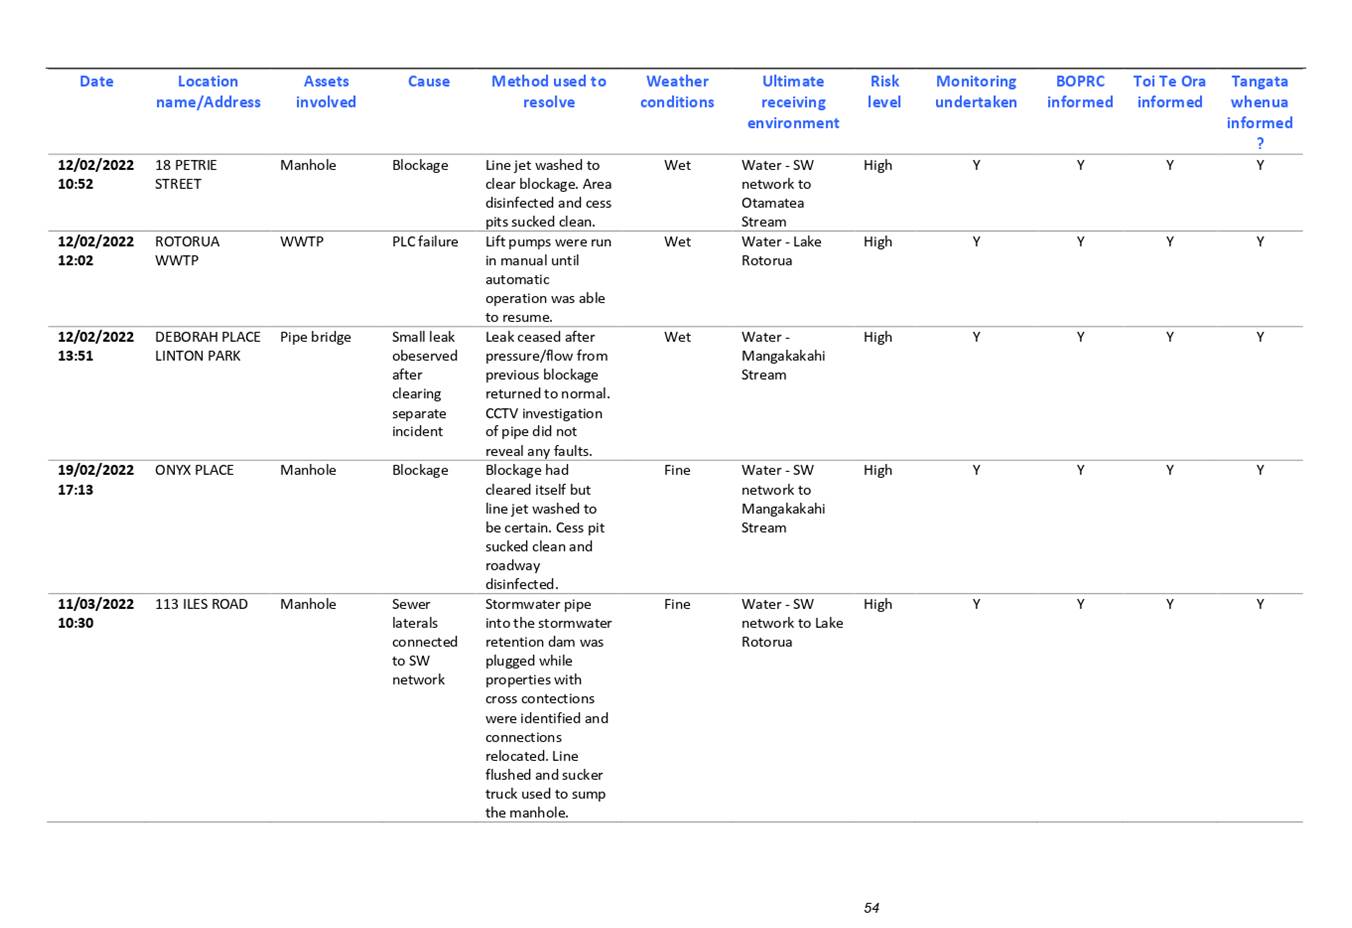
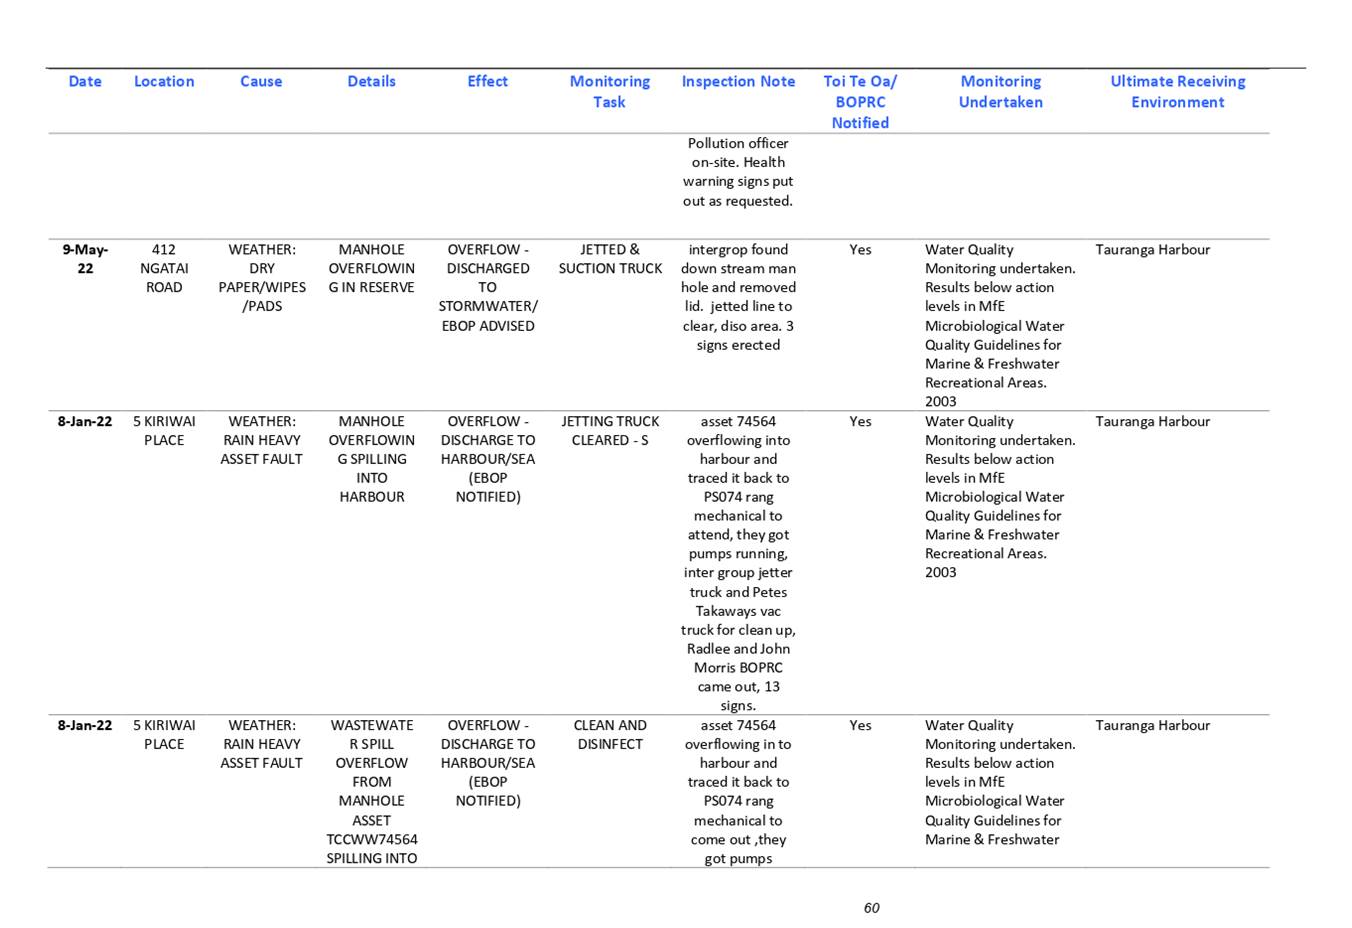
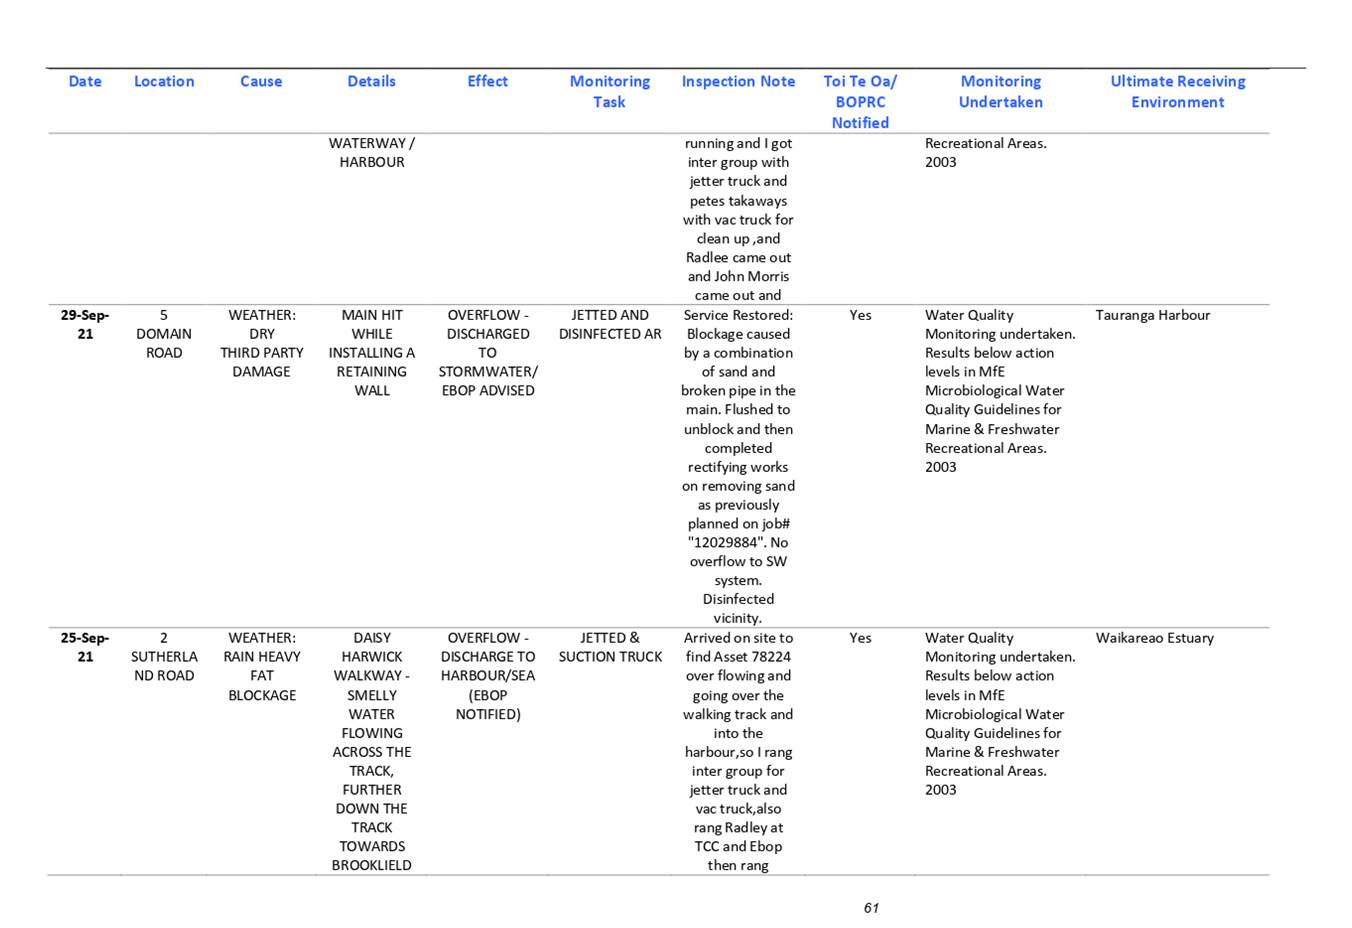
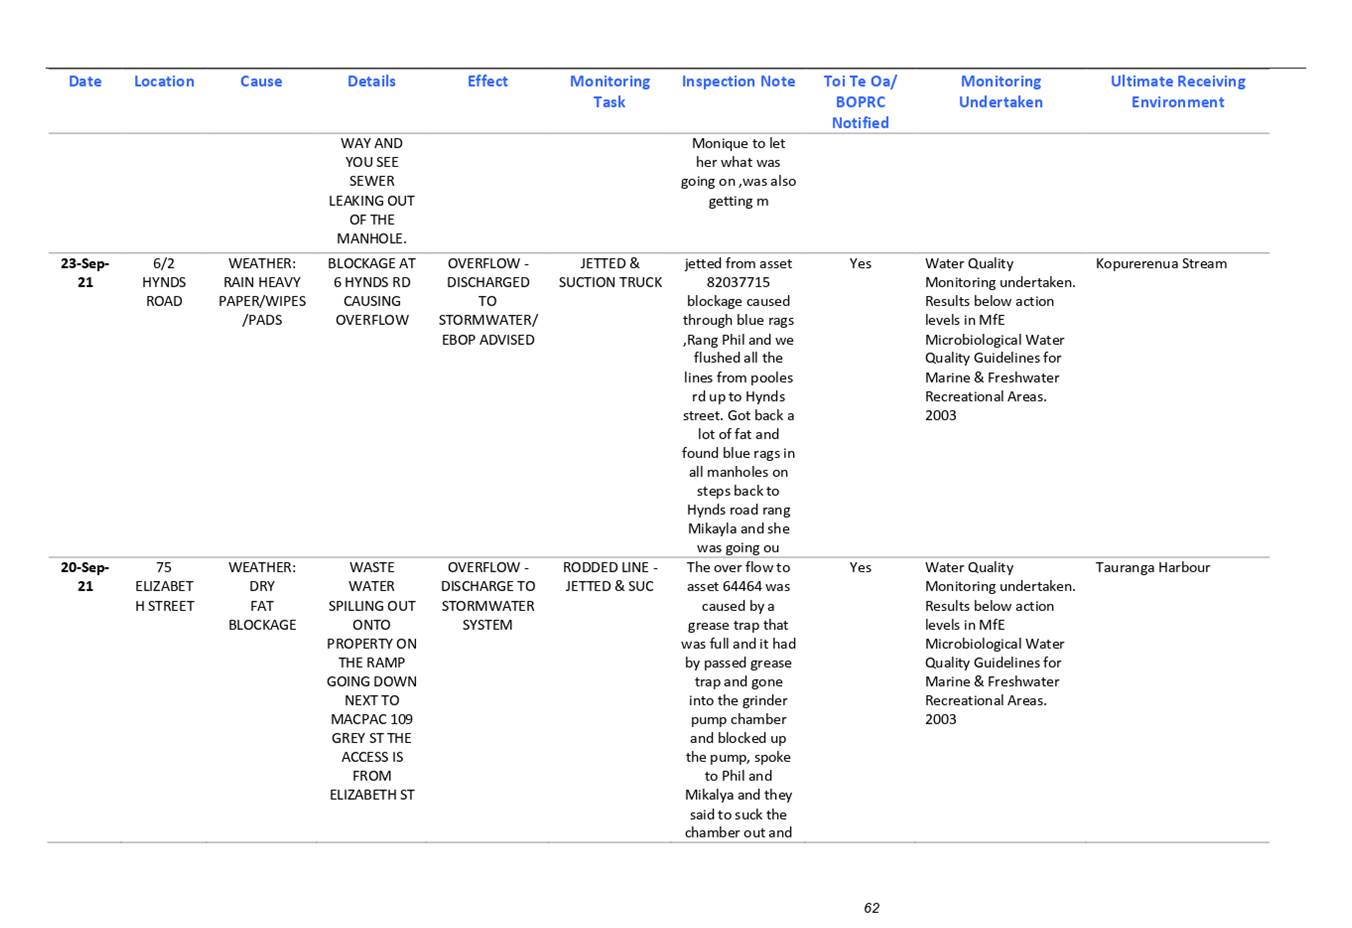
6.6 Overview of Municipal
Wastewater Compliance in Bay of Plenty Region 1
Attachment 1 - Overview of WWTP
Compliance in BOP Region February 2023_Final 1
6.7 Mount Maunganui
Industrial Area update 1
Attachment 1 - Table of all PM10
exceedances PDF 1
Supporting Document 1 - Mount Air
Quality Working Party meeting minutes and presentations from Wednesday 22
February 2023
6.8 Weather Events,
January - February 2023 1
Attachment 1 - Weather Events,
January - February 2023 Lake Levels 1
6.9 Tauranga Moana Land
Management Operations Update 1
7. Consideration
of Items not on the Agenda
|
|
|
|
|
|
Report To:
|
Monitoring
and Operations Committee
|
|
Meeting
Date:
|
7 March
2023
|
|
Report
Authoriser:
|
Reuben Fraser, General Manager
Regulatory Services
|
|
|
|
|
Executive Summary
This report provides
an update on key matters of interest for Monitoring and Operations Committee
members including:
· freshwater
farm plans,
· Whakarewarewa
wallaby containment fence construction update,
· Wallaby
branded ute,
· Lake
Ōkataina hornwort incursion management,
· laboratory
services,
· new
co-funding from Central Government,
· resource
consents update,
· regulatory
compliance update,
· the draft
2023 Monitoring Operations Committee workplan, and
· the
Cyclone Gabrielle response.
|
Recommendations
That the Monitoring and Operations Committee:
1 Receives the report, Chairperson's Report.
1. Purpose
This report provides an update on key matters of interest
for Monitoring and Operations Committee members.
2. Matters of potential interest
2.1 Freshwater
Farm Plans
Freshwater Farm Plan (FW-FP) regulations are currently
being finalised and are expected to be gazetted by the government in early
2023. They are a key part of the Essential Freshwater work programme to improve
water quality and provide a nationally consistent farm planning framework.
FW-FPs will be a mandatory and enforceable tool subject to
Compliance, Monitoring and Enforcement functions by Councils under the RMA.
They will require certification and audit.
FW-FPs will need to consider the risks of the
farming/growing operation on local water quality (catchment context, values and
challenges), and identify practical time-bound actions on farm to help improve
the health of water.
As a minimum, BOPRC will need to support FW-FP
implementation through:
o Providing
our best available information on catchment context, values and challenges to
be considered in the FW-FP (this work is already occurring as part of our BOPRC
Essential Freshwater Policy programme)
o Working
on the regional training and appointment of FW-FP certifiers and auditors (with
the support of a National Appointment Body, yet to be established, and Te Uru
Kahika), and
o Fulfilling
our Council compliance, monitoring and enforcement functions for FW-FPs under
the RMA.
FW-FPs are likely to be phased in by the government in the
Bay of Plenty Region around mid-2024. There will likely be FW-FP
resourcing/capacity limitations across the country, and other unknowns that are
currently being worked through as we await certainty through final FW-FP
regulations.
Staff will report back to this committee once the
regulations and timing for the Bay of Plenty have been confirmed.
2.2 Whakarewarewa Wallaby
Containment Fence Construction Update
Following the signing of the last of the
landowner agreements, construction works on the Whakarewarewa wallaby
containment fence are now underway. Mulching to clear excess vegetation off the
fence line has been completed on multiple sections of the project and first
500m of fence erected at the
Ford Farm.
The principal
contractor, Kenai Ltd, have organised a meeting of all subcontractors at the
site to enable effective planning for the delivery of this complex project and
ensure all parties are working safely together on
the project. The project team is also working closely with the forest managers,
Timberlands Limited, to coordinate fence construction with current and pending
forestry activities.
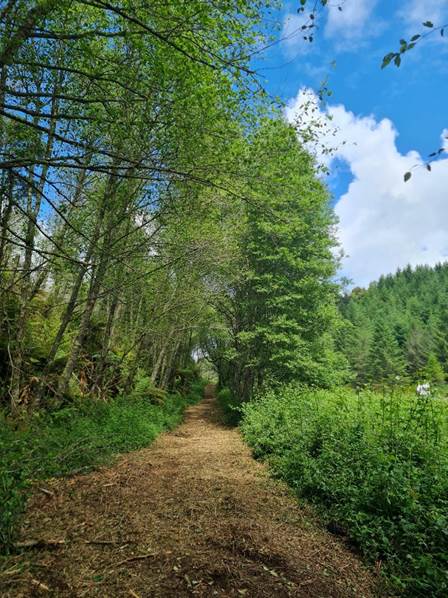
Photo 1:
Mulched line ready for fencing
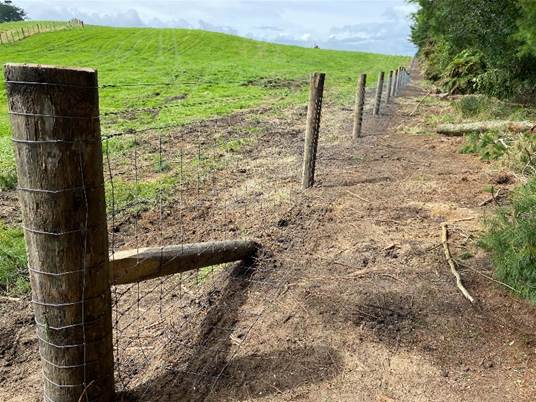
Photo 2:
Wallaby Fence, Ford Farm
2.3 Wallaby Branded Ute
Biosecurity Officer Dale
Williams picked up the new wallaby-branded ute recently, ready for use in
Rotorua. Based on people taking photos of the vehicle in the street enroute to
being delivered, it’s going to be a great billboard to prompt the public
to report wallaby sightings on the reportwallabies.nz site.
It’s been estimated that
without control, wallabies could occupy a third of the North Island (and the
same in the South Island) within 50 years. Bay of Plenty Regional Council is a
key player for the Central North Island, Tipu Mātoro – Wallaby Free
Aotearoa programme, and in order to succeed we need the help of everyone to help
stop their spread by reporting sightings.
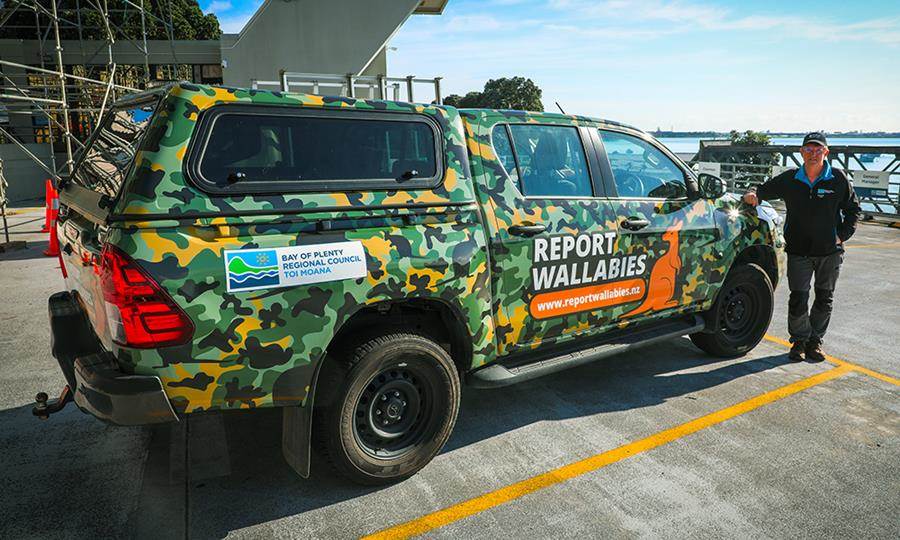
Photo 3:
Biosecurity Officer Dale Williams with the Wallaby-branded vehicle
The reporting of any wallaby
sighting outside of the Containment Zone (see below map) is the key priority
but any sighting reported helps to build the picture of the scale of the
wallaby issue. For more information about the programme and the issues caused
by wallabies community members can go to the wallaby project page on the BOPRC website https://www.boprc.govt.nz/our-projects/dama-wallaby-control.
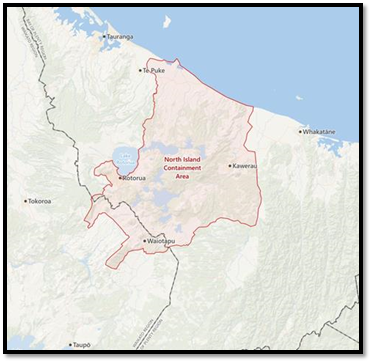
Figure 1: Map
of Wallaby Containment Zone
2.4 Lake Ōkataina Hornwort
Management
The Biosecurity dive team has
completed surveillance as part of the Hornwort Incursion Management Plan for
Lake Ōkataina. Hornwort plants and fragment were found in 2010 within Lake
Ōkataina. The current round of surveillance has not detected the presence
of hornwort within the lake. Plants that were detected at two sites in February
2022 were controlled with Diquat (an aquatic herbicide) and these sites were
thoroughly checked during this surveillance round and no plants were detected.
This is an excellent result for the ongoing management of hornwort with Lake
Ōkataina.
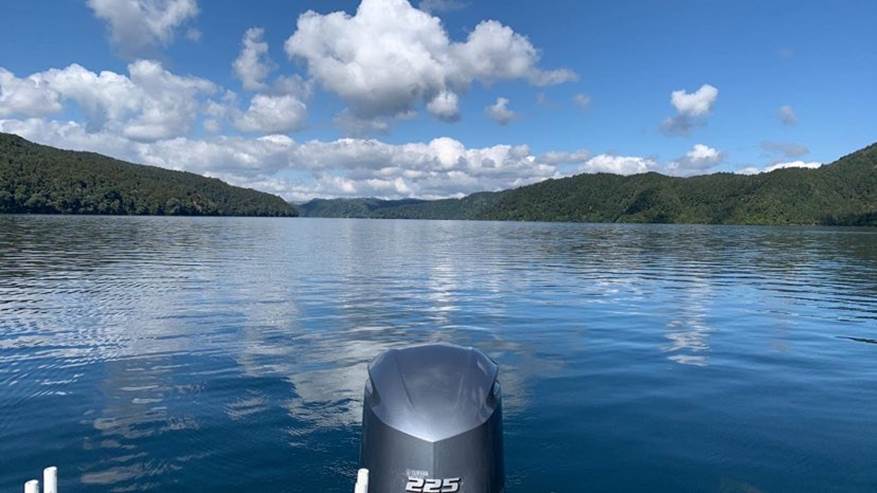
Photo 4: Lake
Ōkataina
2.5 New co-funding from Central
Government
2.5.1 Hill Country Erosion Funding
The Ministry of Primary
Industries “Hill Country Erosion Fund” has tentatively confirmed
that they intend to fund BOPRC a total of $774,480 towards the Land Management
works programme over the next five years. Funding will come online in July 2023
and will be used to support key activities such as the fencing, retirement and
planting of steep erodible land, as well as soil conservation initiatives like
poplar pole planting. The funding will be administered by the land management
team through our Environmental Programme Agreements, with matching co-funding
provided from BOPRC. Work will especially target Focus Catchments requiring
sediment and phosphorus reductions under the Essential Freshwater Programme
priorities. This new funding is a welcomed co-funding partnership opportunity
to increase the scale and quality of works possible with Council funding alone,
with our previous “One Billion Trees” funding from MPI now entering
its final year and already fully allocated to community.
2.5.2 Essential Freshwater Fund
The Ministry for the Environment
has committed $450,000 over the next three years to support our Essential
Freshwater implementation. The funding will be used by the Land Management and
Policy teams to help with things like the coordination and support of catchment
groups, development of ‘catchment context’ information (including
for Freshwater Farm Plans), specialist rural-professional input into the
development of the new Regional Natural Resources Plan, and priority
on-the-ground land management works in Focus Catchments.
2.5.3 Te Wahapu o Waihī
A significant
new collaborative partnership between iwi has been building momentum in the
past 15 months. Te Wahapū o Waihī (TWOW) includes iwi leaders from
Ngati Whakahemo, Ngati Whakaue ki Maketu, Ngati Makino, Ngati Pikiao and
Tapuika and has set itself a vision that aligns closely with that of Council in
terms of improving the health of the Waihī Estuary. They have sought and
successfully obtained $2.9 million from the Ministry for the
Environment’s Freshwater Improvement Fund. Council is both the grantee
for that funding and a partner in co-funding and delivering the workstreams
identified, where the outcomes sought are shared. This will include works such
as the creation of saltmarsh and other priority land management initiatives
like new stock exclusion fencing and native planting (co-funded through our
Environmental Programme’s).
2.6 Data Services
2.6.1 Laboratory services
The laboratory continues to see growth in
use of its services, by both internal and external users, with for the first time over 11,000 samples being received in a calendar
year. Those samples resulted in 87,700 individual analyses and test
results.
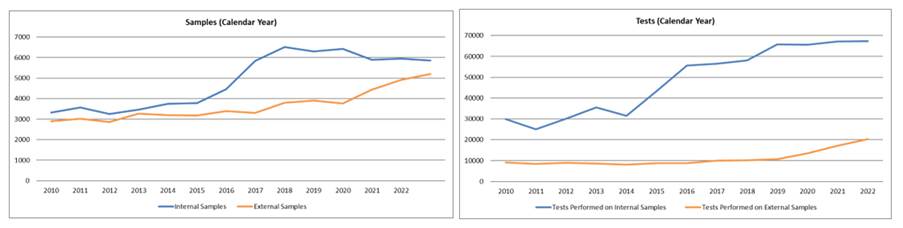
Figure 2 Laboratory
sample and test number for 2022.
Notable is the growth in external
services, which are cost recovered, due to increased territorial Council work
and industry testing relating to crop and fruit production.
2.6.2 Environmental Data
Continued wet weather over the past eight
months had the region saturated and very responsive to storm events that have recently affected the region, which in turn has the data collection
staff busy keeping monitoring and reporting infrastructure operational and
undertaking flood flow measurements. Further preliminary data and information
related to these events is provided within a separate item in the agenda.
The value of the Environmental Data
Portal and open access to data can be seen with these types of events,
demonstrated by the large increase of use in January due to the Auckland
Anniversary severe weather event, we expect February to show a similar result
due to Cyclone Gabrielle.
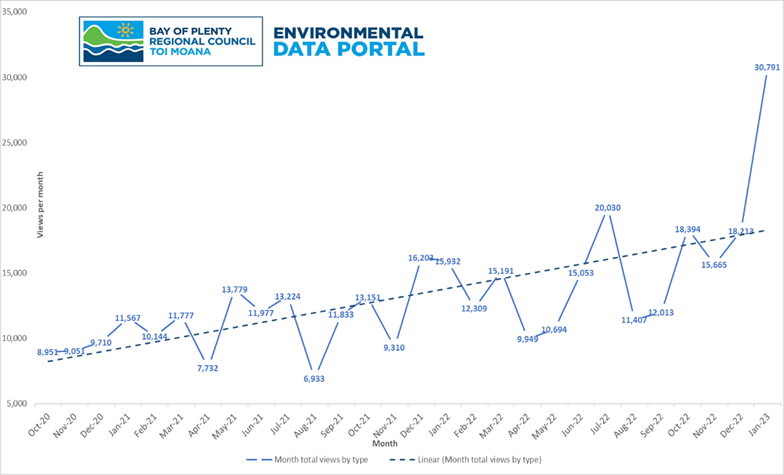
Figure 3: visits to the
data portal
2.7 Resource Consents Update
The number of applications is
trending towards an average of just over 50 a month dropping since a peak in
mid-2020. The monthly average number of applications lodged is down by around
10 applications compared to previous years.
Decisions made continues to
follow a similar trend and more closely matches applications received since
2021.
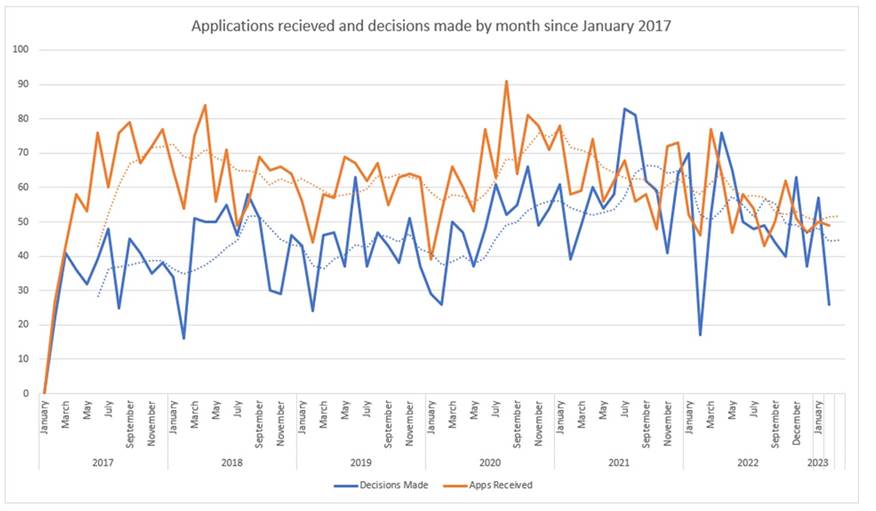
Figure 4: Consent
applications received and decisions made
Groundwater Takes, Lake
Structure and Earthworks application were the three major activities granted
for the year to date. Bore drilling, dairy and discharges to land (Contaminated
land remediation and stormwater discharges) were the next highest categories.
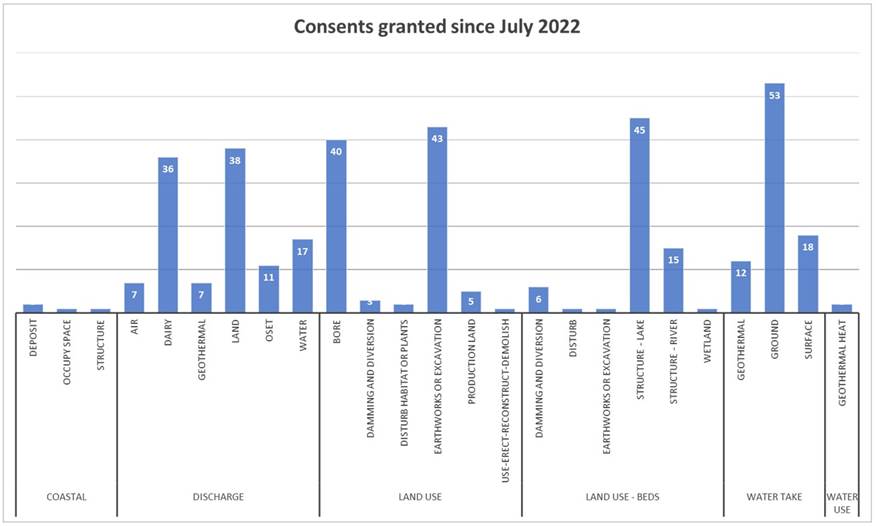
Figure 5: Consent types
granted since July 2022
Since September we have received
32 responses to our customer satisfaction survey. We continue to receive
generally positive feedback from our applicants through the customer
satisfaction survey (28 of 31 responses), written guidance information and
forms are found to be helpful and easy to understand. Customers appreciate the
consents team clearly explaining the process to them, particularly being able
to ring and get further information. Applications processed quickly have been
very well received by applicants.
Four applicants were
dissatisfied with our customer service and their comments point to delays in
the consenting process and not being kept informed by the processing planner.
This is a good reminder for us to keep applicants informed and where there are
delays give them as much assurance as we can on the process. It has also
identified opportunities to work with our consultant planners to ensure we
deliver better service for applicants.
Staff have received specific
recognition from applicants. For example:
· Yvette was
excellent to deal with and was very understanding of time constraints
surrounding this project. The overall project/consent was quite complex with a
lot of moving parts which makes Yvette's work, patience, and communication even
more impressive.
· Jacob was
fantastic to deal with. Great communication and responsiveness through the
entire process.
· Marlene is
an absolute legend. Pragmatic, solutions-focused, well versed in technical
matters and a fantastic communicator.
2.7.1 Matters of interest
There have been
some significant staffing changes within the Consents Team over this period.
With Reuben moving into the GM Role, Ella Tennent was
appointed into the Consents Manager Role which gave us the opportunity to bring
in Paula Golsby to the team as a Principal Advisor. Paula brings with her
a wealth of knowledge and experience that is really enhancing the way the team
works.
The Consents
Team, primarily Paula Golsby, provided input on consenting related provisions
for the Council’s submission on the Natural and
Built Environment Bill. Our focus was on ensuring workable provisions
that facilitate good consent processes and deliver on the outcomes anticipated
by the Bill, as well as the intent of the Resource Management reform.
On 19 October,
the Consents team held their last team hui of the year at Tipapa Marae
in Murupara. It was a good opportunity to sit down and get to know more about
Ngāti Manawa and their aspirations for the rohe.
We discussed how Ngāti Manawa would like things to work moving forward as well as some of
the large topical consents. The highlight of the day was when the Ngāt
Manawa cultural monitoring team showed us all of the work they have been doing
to monitor and look after the long finned tuna (eel) in the Rangitaiki River. The
team walked away with a better understanding of how Ngāti Manawa whakapapa
to the tuna, why water quality is so important to them and the impact some of
the consents we process can have on their cultural identity.
On 25 October a
hearing was held for the Tauranga City Council application to upgrade the
Ohauiti stormwater network. The decision was to grant but is possibly pending
an appeal.
We are in the
process of reviewing the Legacy crematorium air discharge consent. The review is almost complete, awaiting final comments from the consent holder
regarding new and amended conditions. The cremator is not in use due to
the prosecution process.
Staff have been
working with the planning team and Western Bay District Council on the
Ōmokoroa Structure Plan, to ensure an integrated approach to stormwater
management between the Structure Plan and the Comprehensive Stormwater Consent
applied for.
The direct
referral Environment Court hearing for Stellar Passage is due to commence next
week and is scheduled to be held over three weeks.
The Genera
consent application (fumigation) hearing has been scheduled for June.
The Ōpōtiki marina consent application hearing is scheduled to commence on 23 March.
The Whanarua
Bay community water supply consent hearing is scheduled for April.
BOPRC has
partnered with the Ministry for the Environment in a pilot programme for
Māori Commissioners to gain experience in consent hearings. The
trial provides for Māori Commissioners that have
certification for RMA decision making to sit in on real hearings and learn from
the experience. An experienced hearing commissioner provides mentoring
through the process. Thus far through this pilot programme, two hearings
have been completed with one Māori Commissioner being an observer and one
as an active participant on the hearing panel.
2.7.2 Appeals
The appeal on
the Tauranga Bridge Marina consent was heard in the Environment Court from the
14-16 November. Staff provided expert planning evidence and answered questions
in court. The Environment Court’s decision is yet to be received
and is unlikely prior to the conclusion of the Port of Tauranga hearing mentioned
above.
In December
2022 the Court of Appeal dismissed the appeals to the Creswell Water Bottling
Consents. Te Rūnanga o Ngāti Awa have now applied for leave to
appeal to the Supreme Court for another legal challenge to the Creswell water
bottling consent. Sustainable Otakiri have also applied for leave to appeal to
the Supreme Court in regards to the Whakatāne District Council
consent.
2.8 Cyclone Gabrielle Response
Comprehensive
information in relation to recent weather events and their impact on council
business is presented in the Weather Events, January - February 2023
report as part of this agenda. That report outlines how the Regional Council
supports location authorities through the analysis of information,
briefings, situation reports and advice.
Ex-tropical
Cyclone Gabrielle was a Category 3 tropical cyclone originating from the Coral
Sea that tracked towards the Northeast of the North Island of New Zealand. This event followed a sustained period of heavy rainfall over
January across the Bay of Plenty with late January recording over 5 times the
historic average. At its peak, the impacts from the event
included:
· Large waves
in excess of 6-8m across eastern and northern coasts with peak wave heights
occurring at 1600 on 13 February 2023
· Storm surge
across coastal regions ranging from over 1m (Tauranga Harbour) to approximately
0.5m east of Ōhiwa
· Severe gale
force winds with gusts of 120-130km/hr in exposed places
· Heavy rain
across the region with 24hr rainfall total of more than 200mm near Waihī
Beach and in the eastern Bay of Plenty Ranges and 140mm in the
northern Tauranga and Rotoehu areas, with lesser amounts across the
remainder of the region.
The following
table outlines the declarations and timelines used across the Bay of Plenty Civil
Defence Emergency Management Group during the Cyclone Gabrielle event.
|
Declaration Notice
|
Start date
|
Expiry date
|
Issued by
|
Terminated by
|
Area covered
|
|
Opotiki District Council State of Local
Emergency
|
08:00hrs
Monday 13 February 2023
|
Monday
13 February 2023
|
Mayor
David Moore
|
Superseded
by the regional State of Emergency
|
Ōpōtiki
District
|
|
Whakatane
District Council State of Local Emergency
|
15:00hrs Monday 13
February 2023
|
Monday 13 February 2023
|
Acting
Mayor Lesley Immink
|
Superseded
by the regional State of Emergency
|
Whakatāne
District
|
|
Western
Bay of Plenty District Council State of Local Emergency
|
19:38hrs Monday 13
February 2023
|
Monday 13 February 2023
|
Mayor
James Denyer
|
Superseded
by the regional State of Emergency
|
Western
Bay of Plenty District
|
|
Local
State of Emergency for the Bay of Plenty Civil Defence Emergency Management
Group area
|
20:00hrs Monday 13
February 2023
|
Tuesday 14 February 2023
|
Mayor
Faylene Tunui, Chair, Bay of Plenty CDEM Group Joint Committee
|
Superseded
by National State of Emergency
|
Bay
of Plenty region
|
|
State
of National Emergency
|
08:30hrs Tuesday 14
February 2023
|
|
Minister
for Emergency ManagementKieran McAnulty
|
|
Northland, Auckland,
Tairāwhiti, Bay of Plenty, Waikato, and Hawkes Bay.
|
|
|
|
|
|
|
|
2.8.1 Summary
of emergency powers exercised
Emergency
powers were used under the declaration for the following response actions:
1. The evacuation of premises or places where necessary
to preserve human life – CDEM Act section 86.
2. The restriction of access to public places or roads
to limit the extent of the emergency – CDEM Act section 88.
3. Carry out inspections on properties to limit the
extent of the emergency – CDEM Act section 92.
2.8.2 Welfare provided
During the
response eight Emergency Evacuation Centres were established by local Emergency
Operations Centres run by territorial authorities to provide support to the
community, including overnight accommodation particularly for pre-emptive
evacuees. They were at Bay Park (Tauranga), War Memorial Hall & Whakatane
Holiday Park (Whakatāne), Ōpōtiki College & Kutarere school
(Ōpōtiki) and Athenree Homestead, the Orchard, Katikati Baptist
Church (Western Bay of Plenty) and Waihī Beach RSA (Western Bay). A total
of 48 evacuees presented themselves at these centres and were able to return
home the day after and all centres were subsequently closed.
Two
Community-led Centres were also set up through a community response, assisting
28 people.
11 Marae opened
their doors throughout the rohe, taking care of 82 people. There are no reports
of these evacuees requiring more support, and we understand all people could
return to their homes.
2.8.3 Support provided to other areas
Councils across
the Bay of Plenty are also providing support to other areas that have been
harder hit. The table below summarises that level of support direct to
emergency coordination centres at the time of writing this report (24 February
2023). In addition to this support various business units across Council have
been providing support direct to their counterparts in Gisborne and Hawkes Bay
(e.g. geospatial support and consenting advice). This support has not included
deployment of staff to date.
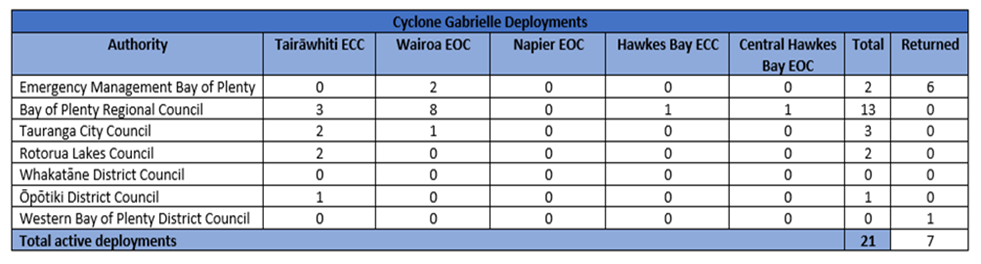
Figure 6: Bay of Plenty
council and emergency management staff deployments
Following the
conclusion of the response a debrief will be conducted to identify any lessons
learnt.
|
|

|
|
|
|
Report To:
|
Monitoring
and Operations Committee
|
|
Meeting
Date:
|
7 March
2023
|
|
Report
Writer:
|
Annabel Chappell, Manager, Special Projects
|
|
Report
Authoriser:
|
Fiona
McTavish, Chief Executive
|
|
Purpose:
|
To update the Committee on progress
with rates collection for the 2022/23 year
|
|
|
|
|
Executive Summary
Following Council’s decision in October 2020 to collect the
regional council rates in-house, our new rates collection service has been
established and the implementation phase of the Rates Collection Project is
now complete.
Collecting our own rates has increased the public’s
awareness of council, and is expected to result in more community
connections, feedback, and engagement. It has also provided transparency of
services, and direct control over the rating system, rates information and
all related processes.
An internal Project Review has been carried out, which identified
and reported on project success measures, additional opportunities for the
wider organisation that were achieved through the project, lessons learnt,
and future improvements identified. These improvements have been included in
a two-year improvements programme.
Cost estimates for in-house rates collection were included in the
Long Term Plan 2021-2031, with a projected saving of $5.9m over the ten year
period in comparison to the previous TA collection model. Now that costs of
the collection service are clearer, this savings estimate has increased to
$7.1m over the same period.
An additional financial benefit of
improved cash flow is estimated to be approximately $400,000 of additional
interest revenue for 2022/23.
|
Recommendations
That the Monitoring and Operations Committee:
1 Receives the report, Rates Collection Update.
1. Introduction
At the 29 October 2020 Council
Meeting, approval was given to collect all Regional Council rates in-house,
with a target date of collecting rates for the 2022/23 financial year. Prior to
1 July 2022 Council relied on the territorial authorities (TAs) to collect the
Regional Council rates on its behalf (except for minor river scheme rates).
The reason for the change was
that Council wished to increase public awareness of the work we do, and the
benefits this work has for the community. Collecting our own rates has
increased the public’s awareness of council, and is expected to result in
more community connections, feedback, and engagement. It has
also provided transparency of services, and direct control over the rating system, rates information, and all related processes.
This report provides Councillors
with a post-implementation review, an update on how the in-house rates
collection is performing, and information on an improvements programme to
further enhance the rates collection service.
1.1 Legislative Framework
The Local Government (Rating)
Act 2002 and the Rating Valuations Act 1998 are the primary enactments
governing the setting, assessment, and collection of rates by Local
Government.
In addition to complying with
this rating specific legislation, Council also needs to ensure that the rating
function and process complies with the Local Government Act 2002 and the
Privacy Act 2020.
1.2 Alignment with Strategic
Framework
|
The Way We Work
|
We
deliver value to our ratepayers and our customers.
|
|
|
We
provide great customer service.
|
|
|
We
continually seek opportunities to innovate and improve.
|
1.2.1 Community Well-beings Assessment
|
Dominant Well-Beings Affected
|
|
¨ Environmental
|
þ Cultural
Medium
- Positive
|
þ Social
Medium
- Positive
|
þ Economic
Medium
- Positive
|
Collecting rates in-house has a
positive effect on social and economic well-being. The economic benefit of the
in-house collection includes less cost to ratepayers as internal costs are
lower than paying other organisations a commission to collect revenue on our
behalf. Also, improved cash flow for council due to receiving rates revenue
earlier than previously, resulting in approximately $400,000 of additional
interest revenue per annum.
Positive social benefits include
the community having more awareness about the work that we do and engaging with
us more, the public receiving an improved customer experience and equity across
the region as council will have control over rating policies and be able to
apply a more consistent and holistic view of the Bay of Plenty community.
Cultural benefits include direct
engagement with Māori landowners and greater control over rating policies
for Māori land. Bay of Plenty Regional Council can decide how to rate
whenua Māori, including decisions on rates arrears, remissions and
consolidation of whenua Māori land blocks or multiple dwellings for rating
purposes.
2. Rates collection implementation
2.1 Background
In October 2020 approval was
given to collect all Regional Council rates in-house, with a target date of
collecting rates for the 2022/23 financial year. Prior to 1 July 2022 Council
relied on the TAs to collect the Regional Council rates on its behalf (except
for minor river scheme rates).
The transition of the rates
collection function from the region’s TLA’s to Bay of Plenty
Regional Council was a significant change project, not only for the Council,
but also for the City and District Councils and the region’s 146,749
ratepayers.
The transition to Bay of Plenty
Regional Council collecting all regional council rates in-house resulted in
direct rates revenue collection of $82m for the 2022/23 financial year.
The project was complex and
challenging, with an ambitious 18-month timeframe.
To manage a project of this
scale eight workstreams, involving up to 70 Council staff in varying
capacities, were involved in the project that delivered on time and within
budget, and generated significant efficiency savings.
2.2 Project closure
The rates invoices for the
2022/23 year were sent out in September 2022 and the due date for payment was
on 20 October 2022. These milestones mark the establishment of our new rates
collection service, and the implementation phase of the Rates Collection Project
is now complete.
An internal Project Review
has already been carried out, which identified and reported on project success
measures, additional opportunities for the wider organisation that were
achieved through the project, lessons learnt, and future improvements
identified.
2.3 Objectives and success measures
At the beginning of the project,
a number of objectives were set. These objectives included
· developing a
customer-centric service,
· providing
better visibility of the relationship between rates and the services they fund,
· increasing
control of rates processes,
· establishing
direct relationships with our ratepayers,
· producing
service delivery cost savings for ratepayers, and
· improving
the opportunity for collaboration with local authorities in the region.
More than a dozen success
measures were identified to provide assurance that these objectives have been
achieved. An example of one of the success measures is that “ratepayers have a clear understanding of the Regional Council rating
change and what they need to do to pay their rates to Bay of Plenty Regional
Council”. The success of this objective can be measured through the
percentage of rates collected.
At the time of
writing this report 96.3% of rates for the 2022/23 year have either been
collected, or are committed through direct debit arrangements.
All initial success measures
have either been achieved, or are in progress through the rating policy review,
which will be undertaken as part of the Long-Term Plan 2024-2034 process.
The statistics provided in
Section 3 of this report demonstrate the high levels of customer engagement
with Council throughout this change process, and the heightened awareness of
Council activities.
2.4 Rates collection improvements
The rates collection service was
a new function for council, with a short delivery timeframe, therefore the
technology system initially implemented was on a ‘minimum viable
product’ basis that achieved the core objectives. In the process of
implementation, several system enhancements were identified that would provide
a more efficient service in the long term. We will continue to work with our
rates technology provider – Magiq - to implement these improvements.
In addition to system
improvements, a range of process improvements were also identified as being
desirable to mature our rates collection service. These improvements have been
included in a two-year improvements programme. Information on significant
improvements and their progress will be reported to this committee on a regular
basis.
One of the priority actions from
this list is to review the historical rating of properties that were discovered
to have been incorrectly charged when the rates data was transferred from some
TAs. This is so that any refunds due can be identified and processed before the
end of this financial year.
A significant improvement
identified will be a review of the river scheme rating categories to update any
changes in property circumstances, and reduce complexity. This is likely to be
a long-term project, with the potential for each river scheme to be reviewed.
Scoping of the project will be carried out in the 2023/24 financial year for
consideration by Council in the Long Term Plan 2024 – 2034.
3. Rates collection information
Some of the desired outcomes of
collecting rates in-house were to increase customer engagement and increase
people’s awareness of the work we do. The following statistics
demonstrate customer reach, the effectiveness of the new rates collection
service, and the effectiveness of our communications around the change.
3.1 Customer engagement (Data as at the end of February 2023)
As this has been the first year
of in-house rates collection, the volume of customer enquiries had been
expected to be higher than in future years as customers are supported through
the change.
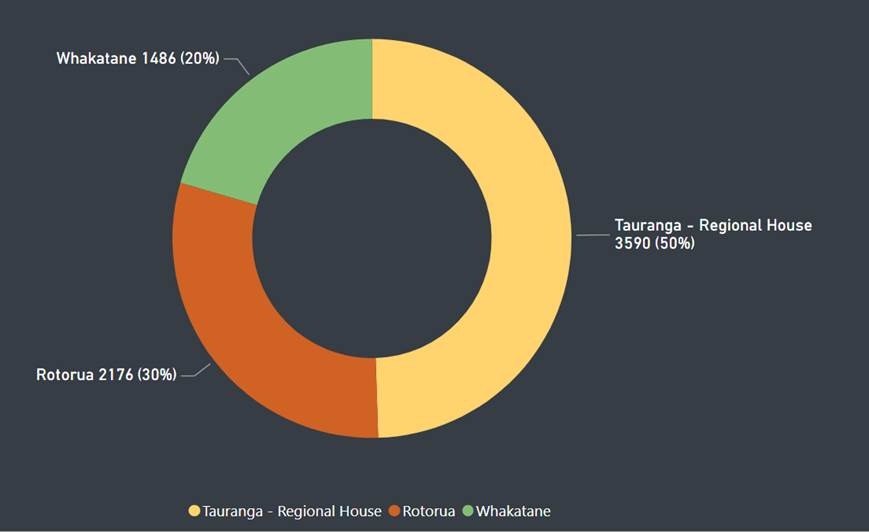
To date we have had the
following customer interactions:
· 147,550
invoices posted out, which included a brochure on the work that rates pay for
· 31,938 rates
related calls to our customer contact centre
· 26,403 rates
service requests logged through our website, by email or through our customer
contact centre
· 7,252
customers visiting our service centres with rates enquiries
Image 1: Customers visiting
our offices by location
· 369
Whenua Māori engagement emails sent to various Iwi, Hapū, Trusts and
organisations, introducing the changes to the rating system and the BOPRC
· 489
Māori Land Service requests logged through our website, email, direct
email and customer contact centre or front counter.
· 22
Māori land review and remission hui held in person, phone conference or
online
· 12 site
visits to local Whenua within the region, Ōpōtiki, Whakatāne,
Tauranga and Western Bay of Plenty areas.
· 379,286
visits to the rates pages on our website
In terms of increasing
customer awareness of the work Council does, approximately 75% of people who
visit our rates pages have then moved on to other pages within the website.
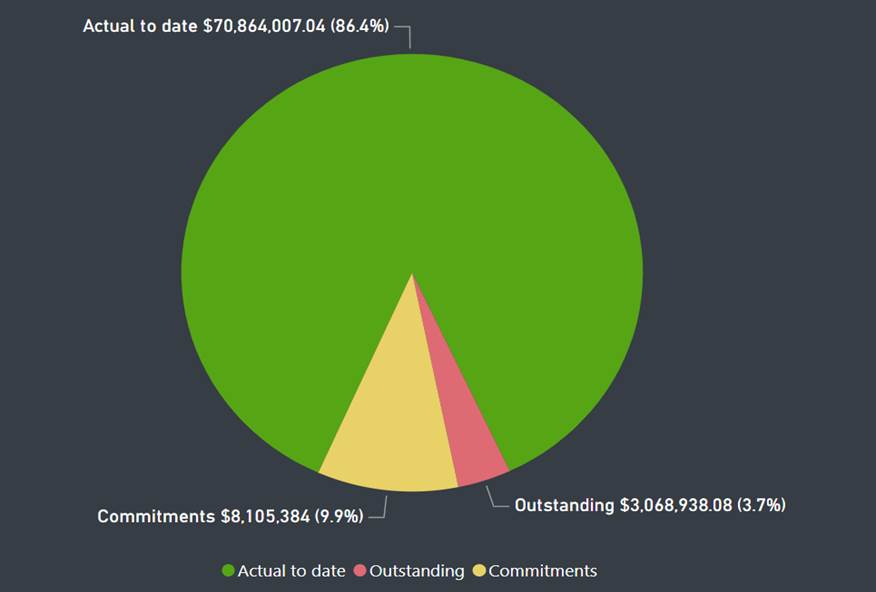
3.2 Revenue
· 76.1% ($62.4
million) of rates were paid as at the due date
· 27,867
penalty letters were sent out
· 96.3%
($78.9m) of rates have been paid as at 24 February 2023
Image 2: Revenue
collected to date
In-house
collection of rates has improved Council’s cash flow. In previous years,
rates collection was characterised by large receipts in September and March
which corresponded with City/District Council instalment dates. This year, the
majority of rates were received in October, and the increasing use of direct
debits is resulting in steady ongoing collections. The chart below shows the
percentage of rates received this year compared to last year.

The financial benefit of the
improved cash flow is estimated to be approximately $400,000 of additional
interest revenue for 2022/23. This figure will probably be higher next year as
the increasing use of direct debits results in more revenue received in July
and August.
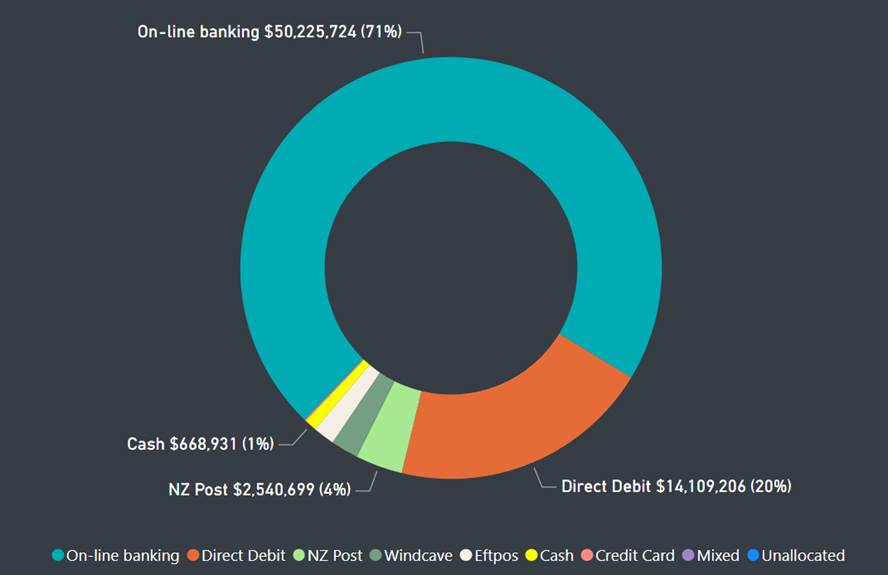
3.3 Payment methods
As part of providing a
customer-centric service, as many payment options have been provided as
practicable. Customers can pay their rates through the following channels:
· Internet
banking
· Over the
counter at our three main offices (EFTPOS, credit card, cash)
· Over the
counter at NZ Post agencies throughout the region
· Direct debit
· Through our
website
Internet banking has been the
most popular method by far, followed by direct debit and then over the counter
payments at either NZ Post or our offices.
Image 3: Customer payment methods
3.4 Direct debits
With a single annual instalment,
the best way to address affordability of payments for our customers was to
provide multiple direct debit options so that customers can smooth their
payments over the financial year rather than having to pay the instalment in a
lump sum.
Extensive promotion of these
direct debit facilities was undertaken, with a result of around 35,000 direct
debits being established.
The most popular direct debit
frequency has been monthly, followed by annually, fortnightly, and weekly.
During the payment process some customers have requested a quarterly option. We
are now looking at offering this as an additional option for the 2023/24 rating
year.
Image
4: Direct debit frequencies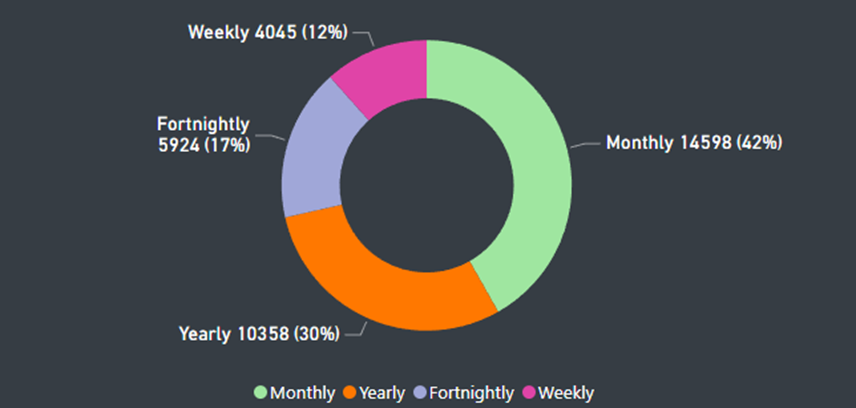
4. Considerations
4.1 Risks and Mitigations
There are no risks in relation
to this service delivery performance update.
4.2 Climate Change
The matters
addressed in this report are of a procedural nature and there is no need to
consider climate change impacts. The project is designed to adapt to our
communities’ views through the investigation of the impact rates
collection could have on Council’s visibility of work, which takes into
account the future impacts of climate change.
4.3 Implications for Māori
Rating Māori land can be complex. Collecting our
own rates, gives Bay of Plenty Regional Council greater control and enables it
to apply equity and fairness across the region. With
our engagement and strengthening relationships we can address economic disparity
and rebuild trust, forging better relationships with local Iwi, Hapū,
Trusts and owner/occupiers. In-house collection means that Council can
establish its own rating policies and will no longer be bound by the TA’s
policies.
With greater control over rating
policies, Bay of Plenty Regional Council will have the ability to decide how to
rate whenua Māori including decisions on rate’s arrears, remissions
and consolidation of whenua Māori land blocks or multiple dwellings for
rating purposes.
4.4 Community Engagement
|

|
INFORM
Whakamōhio
|
To provide affected communities with balanced and
objective information to assist them in understanding the problems,
alternatives and/or solutions.
|
Rates collection is a statutory
process under the Local Government (Rating) Act 2002 and the Rating Valuations
Act 1988. Information provided to customers around the rating process is done
so under the Act requirements.
4.5 Financial Implications
Once the decision was made to
collect rates in-house the estimated costs of internal rates collection were
compared against the costs, we would have faced had we continued with the TA
commission model over the Long Term Plan 2021-2031 to identify the potential
efficiencies of the initiative.
Cost estimates were included in
the Long Term Plan 2021-2031, with a projected saving of $5.9m over the ten
year period.
The majority of actual costs for
rates collection are now known, with the exception of the District Valuation
Roll (DVR) cost sharing calculation that is prescribed in the Local Government
(Rating) Act 2002 which is yet to be finalised with the TAs. This cost sharing
is for valuation services and maintenance of the DVR and replaces the
commission paid for the entire rates collection service previously provided by
the TAs on our behalf.
The actual costs (excluding the
DVR cost sharing which remains an estimate) and efficiencies achieved in
relation to the previous TA rates collection service model are as follows, and
includes estimated future amounts that would have been payable if Council
hadn’t agreed to collect rates in-house:
|
Expenditure
|
Y1 – Y5
(2021/22 –
2025/26)
|
Y5 – Y10
(2026/27
– 2030/31)
|
Total
|
|
TLA
Collection model
(Based on
rates collection for AP 22/23)
|
$13.6m
|
$16.7m
|
$30.3m
|
|
|
|
|
|
|
Rates
collection costs (2021-2031)
|
$10.6m
|
$12.5m
|
$23.2m
|
|
Efficiencies
|
$3m
|
$4.2m
|
$7.1m
|
The
additional financial benefit of the improved cash flow is estimated to be
approximately $400,000 of additional interest revenue for 2022/23.
5. Next Steps
The collection of rates for the 2022/23 year
continues, with the first rate reminder letters were recently sent out for the
3.7% of outstanding rates.
The programme of rates collection improvements has
commenced, and progress on these improvements will be reported to the next
meeting of this Committee.
|
|

|
|
|
|
Report To:
|
Monitoring
and Operations Committee
|
|
Meeting
Date:
|
7 March
2023
|
|
Report
Writer:
|
Rachael Burgess, Customer Contact
Manager
|
|
Report
Authoriser:
|
Mat
Taylor, General Manager, Corporate
|
|
Purpose:
|
To update the committee on customer
service performance
|
|
|
|
Customer
Service Performance Update
|
Executive Summary
This report provides a comprehensive analysis of our customer service
performance, including the quality of service provided, customer satisfaction
levels, and overall performance metrics. The data allows us to identify areas
of strength and areas for improvement, with the ultimate goal of enhancing
the customer experience and driving business efficiency.
This report also highlights the successful implementation of the Rates
Transition Project. As a result of this project, we have implemented new
rates collection processes that have enhanced our customers' experience by
providing a more efficient and user-friendly service. We have reviewed the
impact of this project on our customer service performance and included key
metrics and data-driven insights, including customer feedback and
satisfaction levels, to measure the success of the project and identify
opportunities for further improvement.
|
Recommendations
That the Monitoring and Operations Committee:
1 Receives the report, Customer Service Performance Update.
1. Introduction
Considerable operational changes
have been made over the past four years to improve the way we engage with our
customers in terms of the technology we use, the processes we follow and the
functionality of our public interfaces. A series of initiatives included in the
Customer First work programme that commenced in early 2019, has ensured that we
now have fit-for-purpose systems and streamlined processes in place to support
an improved service delivery. These initiatives have resulted in an improved
level of service and have had a positive impact on customer satisfaction
levels. They have also supported our readiness for collecting our own rates
payments as part of the rates transition project.
Prior to the rates transition
project getting underway, extensive research was carried out to ensure we had
the most customer-centric, effective, and efficient in-house rates collection
function and that the rates collection change was well communicated to our
rates customers. A detailed communications plan was developed to inform
ratepayers of the change as well as promoting the various payment methods
available.
Over the four-month period
following the release of rates invoices and penalty notices, phone calls,
visitor numbers and email enquiries have doubled in volume. In order to
carefully monitor this growing number of enquiries, a rates dashboard was
developed to capture rates-specific data during the collection period. This
data was reviewed daily by the rates project team to ensure adequate resourcing
was in place to respond to peak periods of enquiries. We were also able to
identify query trends based on the feedback received from customers and use
this to update the messaging provided through our various communications
platforms, effectively reducing the pressure on our customer service channels.
Now that the first year of
in-house rates collection is largely complete, we are reviewing customer data
and feedback to identify opportunities for further improvement before invoicing
gets underway again later this year. We expect that in future years, the volume
of customer enquiries will be much less as customers will have adjusted to the
change and many now have direct debits in place.
1.1 Alignment with Strategic
Framework
|
A Healthy Environment
|
|
|
Freshwater for Life
|
|
|
Safe and Resilient Communities
|
|
|
A Vibrant Region
|
|
|
The Way We Work
|
We
provide great customer service.
|
|
|
We
deliver value to our ratepayers and our customers
|
|
|
We
continually seek opportunities to innovate and improve
|
2. Customer Service Performance
2.1 Customer Contact Centre
Highlights
In the 12 months ending 31
January 2023, approximately 129,000 customer queries were received across our
six customer service channels. For queries that require a response, service
tickets are generated in Zendesk, our customer relationship management system
(CRM).
There were 128,000 Zendesk
service tickets generated and resolved during this 12-month period. This is an
80% increase in service tickets compared to the previous reporting period
ending 31 July 2022 and this is attributed to the large volume of rates queries
received during the rates collection period.
|
Phone
|
Reception
|
Email
|
Web Query
|
Social Media
|
Antenno
|
Total Queries
|
Zendesk Service Tickets
|
|
58,655
46%
|
21,187
16.5%
|
17,296
13.5%
|
2,471
1.4%
|
200
0.2%
|
130
0.1%
|
99,939
|
128,237
|
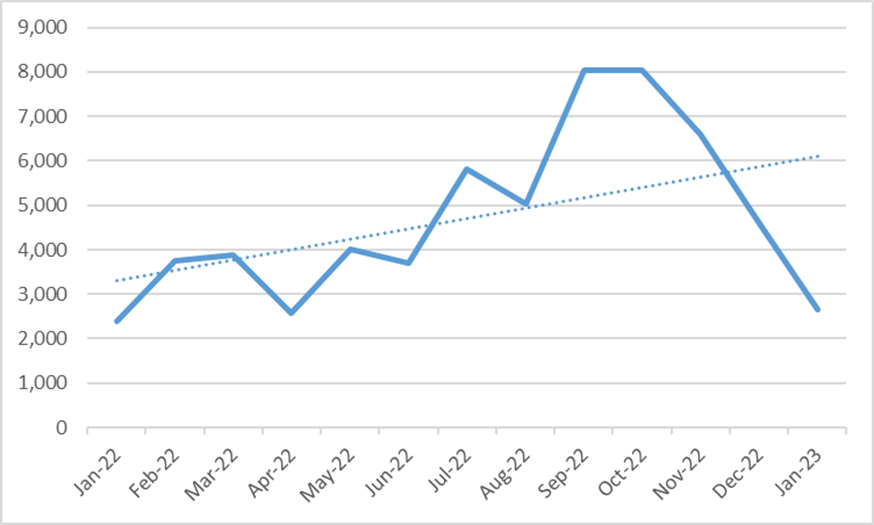
2.1.1 Call Volumes
Calls were the most popular
method of contact with 58,700 calls received during the 12 months. This is a
38% increase in calls compared to the previous reporting period ending 31 July
2022. Information relating to the rates collection changes were sent to rates
customers in April 2022 and this resulted in call volumes starting to trend
upwards as customers sought to understand the change. Call volumes peaked
during August and September when rates invoices were released with approx. 8,000
calls received during both months. Call volumes were still sitting above
previous averages through October and November as a result of the penalty
notices being sent. Call volumes have then reduced in December.
Volume of calls received from January 2022 to January 2023
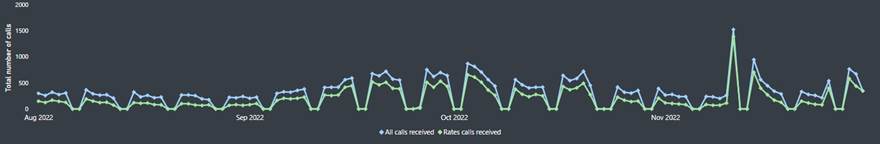
During the
period from August 2022 to November 2022, rates-related calls accounted for
half of all calls received into the call centre. The call centre
experienced its busiest day on 11 November when 1385 calls were received
following the release of penalty notices to rates customers.
Rates calls received from August 2022 to November 2022
During peak periods where call
volumes averaged 500 per day it was not possible to answer every call
immediately. A call-back service was available so people could save their place
in the queue. This was well-received by customers as we were able to respond to
call backs within a 24-hour timeframe in most cases.
2.1.2 Call Categories
There are five separate phone
lines that are managed by our internal call centre. These include the BOPRC
general query phone line, the Baybus phone line, the pollution hotline, the
0800 5KNOTS maritime line and the new rates phone line that was introduced in
April when the rates communication campaign was launched.
Having a
dedicated rates phone line allowed the team to better manage the calls coming
into the call centre by providing better visibility of rates call patterns for
reporting purposes. It also meant that specific rates messaging could be used
while callers were waiting for their call to be answered. During the rates
collection period, we used customised messaging to respond to common queries
and this meant that customers were able to get the information they needed
without needing to speak to a customer service agent. This resulted in a
reduction on call volumes overall and allowed us to better manage peak call
periods by reducing the pressure on the call centre team.
The following graph shows the
volume of calls received to each of these phone lines for the 12 months ending
31 January 2023.
Phone
Line Statistics from February 2022 to January 2023
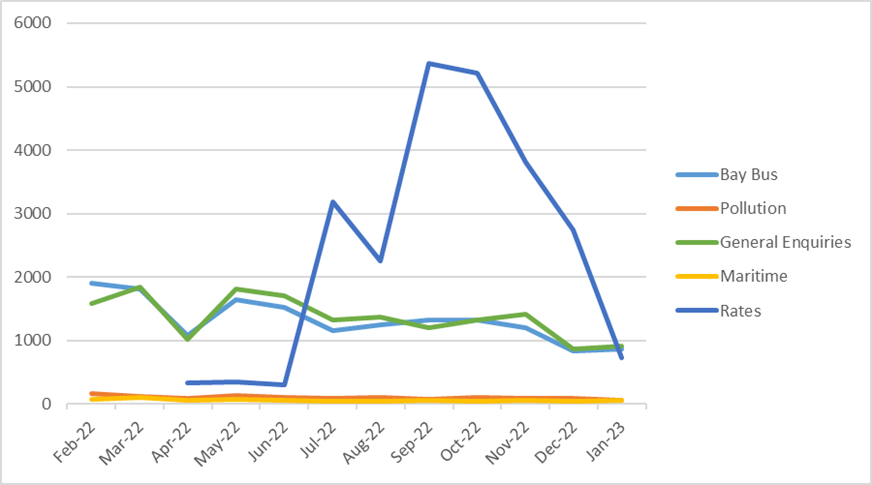
Rates-related calls make up the
largest call category, increasing our overall call volumes by 38%. The call centre received approximately 150 rates-related calls per
day during April, May and June after rates communication campaign went live.
The graph shows these calls then increase significantly in July after the
direct debit letters were sent to ratepayers and then again in August when the
invoices were released across the region.
A total of
22,300 rates calls have been received and a total of 16,500 Zendesk tickets
have been generated during the rates transition project. This is a considerable
number of tickets that required a resolution and during peak periods staff
members from across the organisation assisted the customer service and rates
teams in responding to service tickets.
When looking at
monthly call volumes, April saw a significant drop in calls across the other
four phone lines. This is consistent with call patterns from previous years
where people take leave over Easter.
Baybus calls
fluctuate between 1,000 and 2,000 calls each month and totalled 16,000 calls
for the 12-month reporting period. Call data shows Baybus calls have been
decreasing since May 2022 as people have adjusted to the weekend timetable that
is currently in place. Maritime calls have remained consistent with
approximately 800 calls received over 12 months. General queries continue to
reduce with 3,500 less calls in the 12-month period ending 31 January 2023. The
reduction in general calls isn’t attributed to a specific business
activity, all call categories have reduced when compared to the previous
reporting period.
Calls to the
pollution prevention hotline have reduced by 28% over the last 12 months. There
is a noticeable reduction in calls from August last year when the compliance
team introduced a proactive media campaign to raise awareness around issues
that commonly occur during certain times of the year. A combination of regular
social media posts as well as leaflet drops were used to communicate pollution
related issues in the community, and this has resulted in less pollution
hotline calls and complaints being received.
2.1.3 Call Abandonment
Abandoned calls are calls that
are disconnected before the customer can connect with a staff member. A call
may be abandoned for many reasons, including the wait time in the queue, a
connection error or a distraction meaning the customer is no longer available
to make the call. The service level measure for call abandonment is based on
the percentage of calls that are able to be answered each month. The service
levels are monitored as these provide an insight into the impact that peak call
periods have on call centre operations and where staff scheduling might need to
be adjusted to meet the demand during certain times of the day.
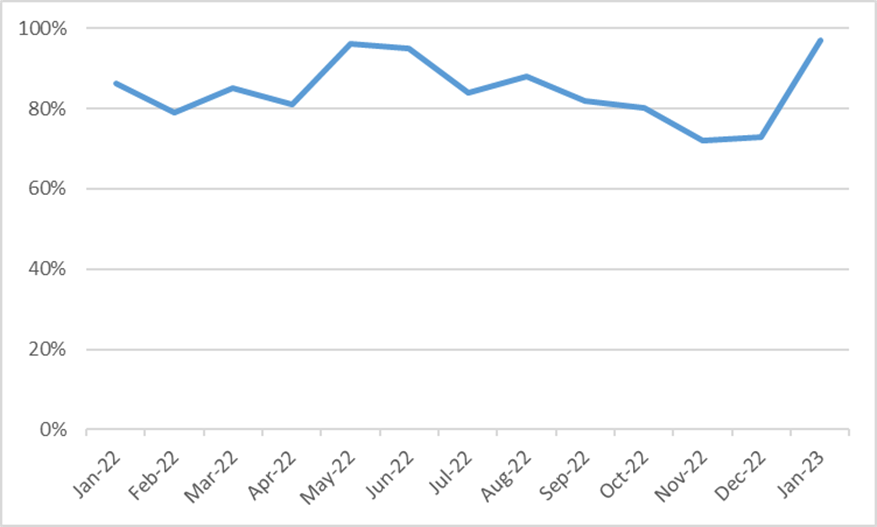
Call abandonment was low during
May and June with the call centre answering 96% of calls. The call answer
service level has then gradually dropped over the following months to 73% due
to the large volumes of rates queries being received each day. In addition to
large volumes of calls being received each day, there were also peak times
during the day when the call queue had a longer waiting time. This can result
in higher levels of abandoned calls; however, our telephony system offers a
call back service which enables customers to retain their place in the queue
and have a customer service advisor call them back rather than having to wait
on the line. Feedback from our customers has been extremely positive about the
call back service and in most cases, we are able to call people back within 24
hours.
Call Answer Service Level
from January 2022 to January 2023
A total of 22,300 rates related
calls were received through the dedicated rates phone line over the last 10
months. 45% of these calls have been answered and resolved by the call centre
immediately, 34% have requested a call back, and 21% have been abandoned. Call
patterns revealed that rates calls were particularly heavy on Mondays between
10am and 2pm so this helped inform the best timing for releasing batches of
emailed invoices. Where possible we were also able to adjust our staff
resourcing during the day to respond to peak call periods as well as employing
additional temporary customer service staff to help manage the higher call
volumes.
When scaling up our resourcing
to accommodate a new service such as rates collection, there is a fine balance
between having enough staff to provide a good service, but not too many to
create additional costs and inefficiencies that essentially have to be borne by
the ratepayer. This balance is particularly difficult when you are planning for
an unknown number of future enquiries. We also experienced further difficulties
with the labour market being particularly challenging and this made it
difficult to source enough skilled people to fill customer service positions,
as well as manage unexpected absences through Covid and other illnesses.
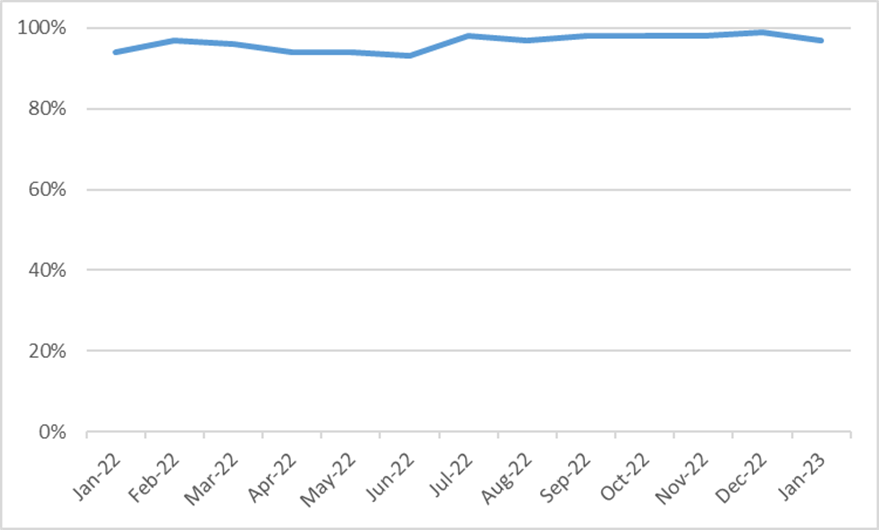
2.1.4 Call Resolution
The Customer Contact Centre has
a Key Performance Indicator (KPI) to resolve 97% of calls at the first point of
contact. While call resolution has been averaging around 95% in recent months,
the KPI target was exceeded in July 2022, achieving a call resolution rate of
98%. With the introduction of the new rates service and the high volume of
calls received in July, this achievement demonstrates that the systems and
processes put in place to support the new rates collection service have been
effective. The average call handing time for rates calls is between 3 – 5
minutes, and this reflects that most enquiries are being dealt with at the
first point of contact.
Call Resolution Service Level
from January 2022 to January 2023
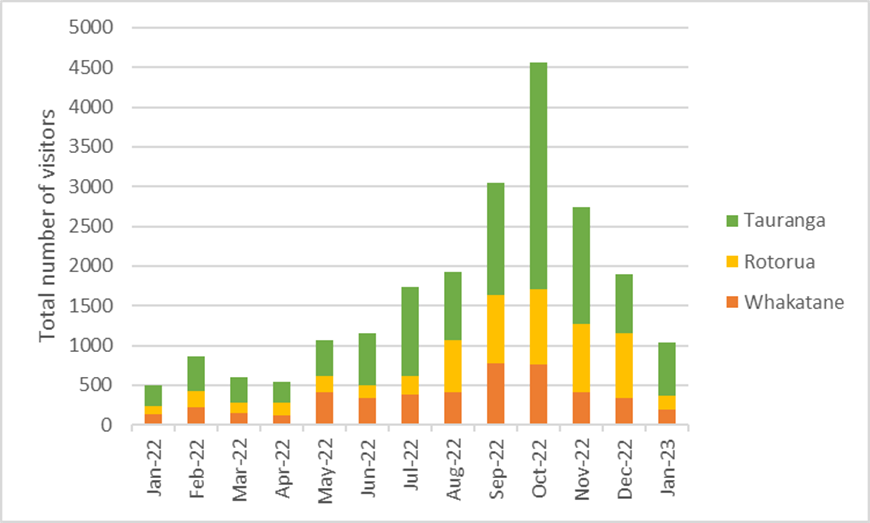
2.1.5 Visitor Numbers
Just over 21,000 people visited
our offices in the 12 months ending 31 January 2023. This is a 70% increase
compared to the same period last year when 12,400 people visited our offices.
This significant increase in visitors is consistent across all offices with 47%
more visitors in Whakatāne, 117% more visitors in Rotorua and 65% more
visitors in Tauranga during the 12-month period.
In terms of monthly trends,
January this year was twice as busy, with double the number of visitors
compared to January last year. Many of these were Bee Card customers wanting to
get their bus card sorted before the start of the school year.
Visitor
numbers per site from January 2022 to January 2023
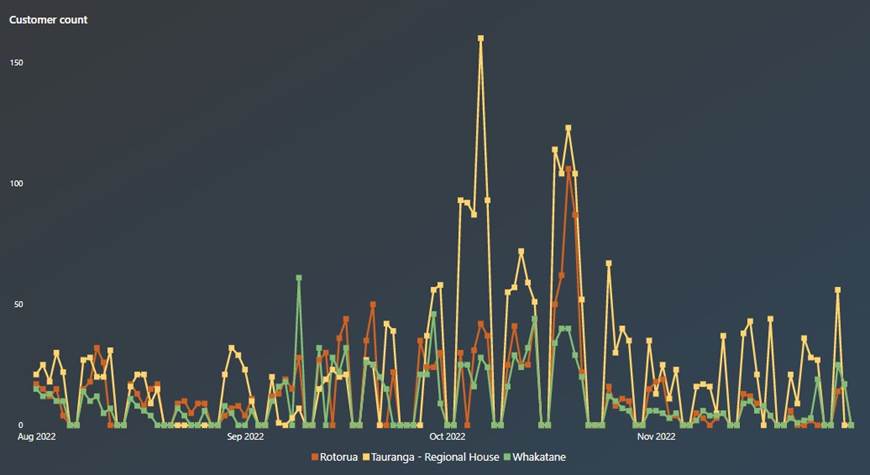
The significant increase in
visitor numbers is a direct result of the rates collection project where many
customers came into our offices to discuss the rates change or make their
payment. During October, visitor numbers peaked at 4,500 with the majority of
these coming to make their rates payment before the 20 October due date. The
busiest day was on 6 October where 160 people visited our Tauranga Office.
Visitor patterns were noted as being quite different to call patterns as there
were no peak times during the day and no particular day of the week that was
noticeably busier. With the rates collection project now largely complete,
visitor numbers have now reduced again to pre-rates levels.
In person rates queries from August to November 2022
2.1.6 Website
One of the key objectives for
the Rates Collection project was to increase people’s awareness of the
work we do, and we’ve been able to gauge how successful this has been by
using the data that relates to our website traffic. For the year ending December
2022, there were 1.2 million page views on our website compared to 542,000
views the previous year. This is a 125% increase in website traffic where 36%
of total visits were to rates-related pages. The most frequently visited rates
page is the property search page which contains the Rating Information
Database. In terms of increasing customer awareness of the work Council
does, our analysis shows that approximately 75% of people who visit our rates
pages have then moved on to other pages within the website.
The new Information Hub with key
rates related FAQs has proven to be highly popular and has reduced the number
of enquiries coming through to the Customer Services team as answers to common
queries can be found easily online.
Top Ten Webpages viewed from
May 2022 to January 2023
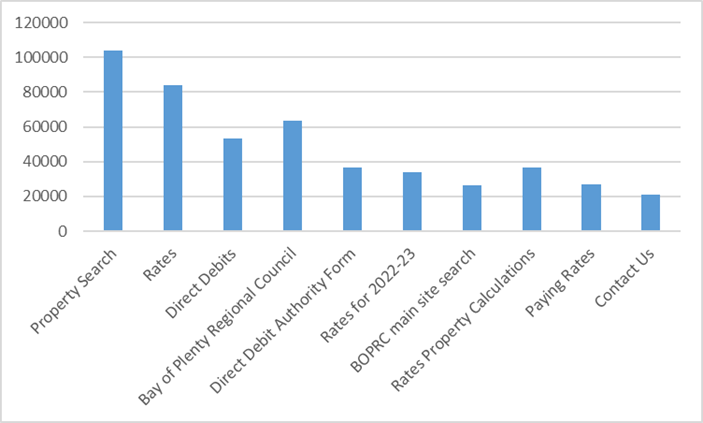
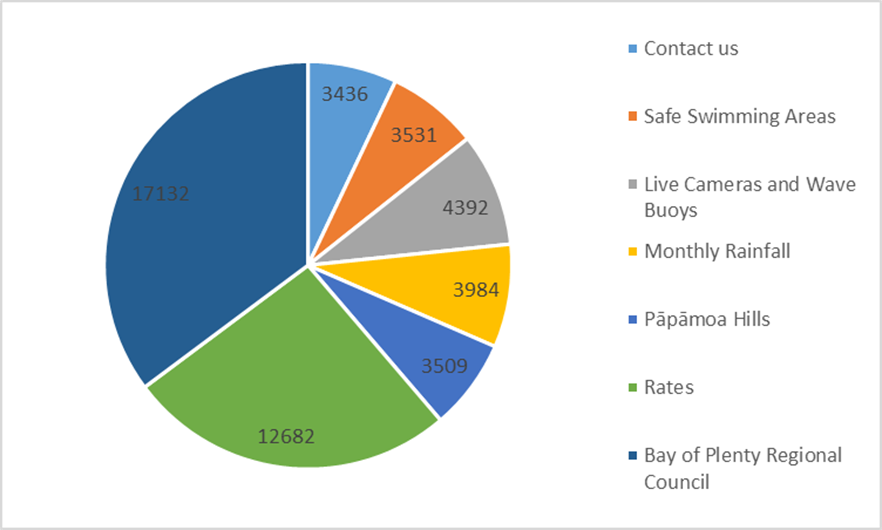
Many people within our community
use our website to access information to common queries and these patterns
change depending on the time of year. The chart below shows that while rates
searches still account for a large amount of web traffic, other types of
seasonal information like monthly rainfall, live cameras and safe swimming
areas are also being searched regularly.
Top Seven Webpage Searches
from May 2022 to January 2023
2.2 Customer Satisfaction
Feedback
Our Customer Relationship
Management (CRM) system provides the ability to develop customer satisfaction
measures that enable customer service performance management and monitoring
across a variety of different customer service touchpoints. This includes comprehensive
data reporting to help us better understand our customers and their needs, as
well as customer satisfaction surveys that provide valuable feedback in regard
to the quality of our service.
Customer Satisfaction surveys
are sent to customers who contact us by email or provide their email address
over the phone. The survey is voluntary, so only a very small proportion of
people reply.
From February 2022 to January
2023, a total of 70,000 surveys were sent to customers, with 5,850 responses
received. This is an overall response rate of 8.4%, up from 6% during the last
reporting period ending 31 July 2022. Collecting this data over a
12-month period has enabled us to analyse the trends that emerge during times
where there are issues arising in the community. We can then focus extra
attention on these services areas to ensure the contact centre have the correct
information they need to respond to queries and that response timeframes are
reasonable.
Recent customer satisfaction
results show that satisfaction levels have improved by 24% across all
categories. The biggest change in customer satisfaction levels was the Baybus
calls which increased by 11%. Customer Satisfaction for rates calls also increased
by 3% over the duration of the project.
Customer
Satisfaction Survey Results from February 2022 to January 2023
|
CALL CATEGORY
|
No. of Responses
|
 
|
 
|
Change from July 22
|
|
General Call Queries
|
2,132
|
80%
|
20%
|
+4
|
|
Rates Calls
|
3,440
|
82%
|
18%
|
+3
|
|
Baybus Calls
|
240
|
76%
|
24%
|
+11
|
|
Consents Calls
|
392
|
87%
|
13%
|
+2
|
|
Pollution Hotline
|
10
|
70%
|
30%
|
+4
|
|
Maritime 0800 5 KNOTS
|
0
|
None received
|
None received
|
-
|
|
TOTAL
|
|
|
|
+24
|
The comments
that are extracted from survey data are also valuable as they provide further
opportunities to improve our service delivery both internally and externally.
We receive a wide range of both positive and negative feedback, and these are
recorded and shared with the respective team activity areas, to ensure that
reoccurring issues are followed up as quickly as possible.
2.2.1 Mystery Shopper Survey Results
Mystery Shopper
surveys are carried out monthly and include a series of calls to each of our
call lines as well as visits to our reception counters when Covid restrictions
allow. Call quality is measured in terms of the service provided, the knowledge
and understanding of the issue and whether the mystery caller was satisfied
with the response. On-site visits also include the office surroundings and
customer interaction aspects of the service being provided in person.
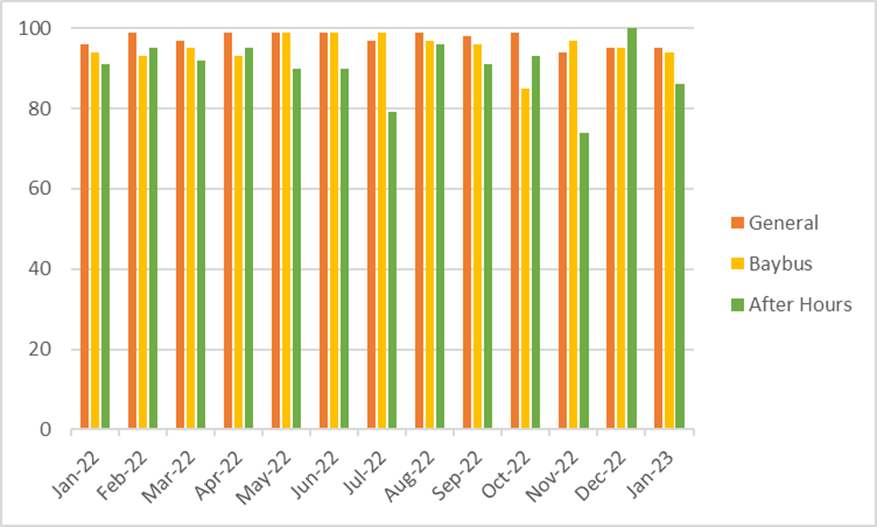
The following
table provides an overview of the mystery shopping results for both calls and
site visits. Since December last year, satisfaction results over 90% have been
achieved for calls managed by our internal call centre. Survey results are
slightly lower for our after-hours call service which dropped below 80% in July
and November 2022. We currently receive very few rates calls after hours;
however, we are providing additional support to our external call service
provider to ensure they have the information they need to resolve our
non-technical rates queries.
Mystery
Shopper survey satisfaction results from February 2022 to January 2023
2.2.2 ALGIM Customer Experience Survey
Results
Each year the Association of
Local Government Information Management (ALGIM) carry out their own Customer
Experience Mystery Shop survey across all councils in New Zealand. The survey
provides a snapshot of the local government sector with guidance on where
councils can improve their customer service delivery. In 2022, a total of 78
councils were surveyed and ranked in terms of their survey results.
Last year we reported that Bay
of Plenty Regional Council was announced runner up for the 2021 Customer
Experience Award, behind Ashburton District Council. In 2022 our ranking has
now dropped to 72 after receiving an overall score of 58.2%. The survey was
carried out during our busiest week of rates calls and this has impacted
negatively on our survey results in terms of responsiveness. There are some
other insights provided in the survey feedback that highlight other areas for
improvement so we will be working with the team to ensure we are better prepared
next year and that we ensure we can still maintain a quality customer service
level during peak call periods.
Of the 78 councils and two CCOs,
30% of organisations delivered an excellent customer experience, 56% delivered
a good customer experience, 11% delivered a fair customer experience, and 3%
delivered a poor customer experience.
3. Considerations
3.1 Risks and Mitigations
Prior to the rates project going
live, several risks were identified as having the potential to negatively
impact on customer service levels during the project. One of these was the risk
that if the volume of customer enquiries were much higher than expected once
the invoices were sent, call response rates could drop leading to customer
dissatisfaction. This could also result in urgent services such as pollution
hotline notifications and maritime emergency calls being stuck in a queue
rather than being answered quickly. While we were able to implement a priority
queue response for the pollution and maritime phone lines to minimise this
risk, we identified that this arrangement is something that requires further
improvement during this years’ rates collection period.
This year we will explore
whether it is more effective to divert these calls to the Regulatory Admin team
during peak calls times to ensure these urgent calls are dealt with as quickly
as possible.
Another risk that was identified
was the need to scale up our resourcing in order to respond to larger call
volumes during the rates invoicing period. This balance is particularly
difficult when you are planning for an unknown number of future enquiries.
While we did employ several temps to help manage our calls and process rates
tickets, we found the labour market was particularly challenging and this made
it difficult to source enough skilled people to fill customer service
positions. We are expecting that there will be less enquiries in the second year
however we will still need additional temporary staff to increase the capacity
within the call centre.
We plan to start this
recruitment earlier to allow more time to secure people and get them well
trained. We also intend to scale up our resourcing to ensure we have enough
cover during the winter months when Covid and other illnesses are more
prevalent.
3.2 Climate Change
Anything we can do to reduce
carbon emissions is important, no matter how small, and that includes how we
engage with our customers through our various customer service channels. We
have four separate service channels available that provide an opportunity for
our customers to connect with us digitally. This is important as recent
customer service data shows a growing trend in people wanting to access
customer services and process their bill payments online.
Our customers are able to access
answers to many frequently asked questions through our website or send us a
request by email or via social media. We also use the Antenno app which helps
ensure members of our community are informed about issues affecting their area
and enables another channel to log requests. In addition to this our customers
can call us 24/7 and speak to a call centre agent. As part of the rates project
planning, it was important that our customers were able to pay their rates
locally at an NZ Post agency as this reduced the need for people to travel into
one of our offices contributing to a reduction in travel emissions.
3.3 Implications for Māori
The Bay of Plenty region is
growing and changing, and this is reflected in our increasingly diverse
population. Embracing cultural differences in customer service empowers our
people to better predict and accommodate the needs of their customers, as well
as connecting with them on a more meaningful and human level. Our customer
service model is designed to provide inclusive and accessible customer service
that all our customers can use and benefit from. Our staff training focusses on
the need to be flexible, patient, and empathetic to ensure that our customers
have a positive customer experience.
3.4 Financial Implications
There are no
material unbudgeted financial implications and this fits within the allocated
budget.
4. Next Steps
4.1 Customer Feedback Summary
Report
One of the key drivers behind
Regional Council moving to collect its own rates is to raise its profile and be
more transparent and accountable for the work they do for the community. As
part of the rates transition project, we also set a goal to deliver customer
service that is as good, or better than the service our customers were
receiving through their TLA. We have been able to measure the impact of the
rates collection change on customer satisfaction and public awareness by
monitoring our website traffic and analysing the feedback received through the
Zendesk customer satisfaction surveys. During the project this information was
used to address common query themes and improving the information we had
available on our website.
For the year ending 31 January
2023, 7,000 survey responses have been received and these were reported at a
high level in the Customer Satisfaction section of this report. The comments
contained in the customer satisfaction survey responses are extremely valuable
as they provide further insight into how customers feel about the service they
are receiving as well as identifying ways that we can further improve our
service delivery.
As a follow up to this customer
service performance update, a more detailed analysis will be carried out using
the survey data collected. The results will then be shared as part of a
comprehensive Customer Feedback Summary report at the next Monitoring and
Operations committee meeting in June 2023.
|
|

|
|
|
|
Report To:
|
Monitoring
and Operations Committee
|
|
Meeting
Date:
|
7 March
2023
|
|
Report
Writer:
|
Nic Newman, Climate Change Programme
Manager and Alicia Burningham, Programme Coordinator Integrated Catchments
|
|
Report
Authoriser:
|
Chris
Ingle, General Manager, Integrated Catchments
|
|
Purpose:
|
Reporting on the Climate Change
Programme of work
|
|
|
|
Climate
Change Quarterly Report
|
Executive Summary
This report provides an update of climate change actions
set out in the Climate Change Action Plan. Delivery and reporting of these
actions occurs through the Climate Change Programme. An attached dashboard
shows progress of each project.
Council has completed its three-year Toitū
CarbonReduce Programme. Internal emissions have been steadily reducing,
however the last wet winter has seen a spike in pumping related emissions.
Staff will present to Council on this item.
Staff have completed mapping potential saltmarsh habitat
in the region and are now working to quantify the sequestration potential of
existing saltmarsh sites. This work along with national initiatives are the
building blocks to unlock the potential of Blue Carbon in the region. Staff
will present to Council on this item.
Tourism Bay of Plenty have been delivering a Council
funded project to assist tourism operators to move to low carbon operations.
A series of 12 week programmes are being delivered across the region. Tourism
Bay of Plenty will present to Council on this item.
|
Recommendations
That the Monitoring and Operations Committee:
1 Receives the report, Climate Change Quarterly Report.
1. Introduction
Climate Change
is a strategic priority and one of the three Impact Areas for Council. Our
vision is to strengthen the long-term resilience and sustainability of the Bay
of Plenty region through climate change action and awareness.
Council adopted
a climate change position statement in the Long-Term Plan, and delivery of our
climate change actions are being managed through the Climate Change Programme,
ensuring coordinated delivery, monitoring, and reporting on the programme of
work.
A new dashboard
is attached to this report to provide a snapshot of progress under the
Programme. Reporting this triennium will move to quarterly, from previous 6
monthly reporting.
1.1 Alignment with Strategic
Framework
|
A Healthy Environment
|
We
develop and implement regional plans and policy to protect our natural
environment.
|
|
Freshwater for Life
|
We collaborate
with others to maintain and improve our water resource for future
generations.
|
|
Safe and Resilient Communities
|
We
provide systems and information to increase understanding of natural hazard
risks and climate change impacts.
|
|
A Vibrant Region
|
We
contribute to delivering integrated planning and growth management strategies
especially for sustainable urban management.
|
|
The Way We Work
|
We look
to partnerships for best outcomes.
|
1.1.1 Community Well-beings Assessment
|
Dominant Well-Beings
Affected
|
|
þ Environmental
|
þ Cultural
|
þ Social
|
þ Economic
|
|
2. Climate Change Programme
Council’s Climate Change
Action Plan identifies 19 Action Plan projects aligned to four goals:
1. Bay of Plenty Regional
Council is net zero carbon by 2050;
2. Reducing regional
greenhouse gas emissions;
3. As a region we
understand, are preparing for and adapting to a changing climate;
4. Our Bay of Plenty
community is aware, engaged, and resilient.
The Action Plan provides the
framework for the climate change programme reporting, while the attached
Programme Dashboard (Appendix 1) shows an overview of the current status for
all projects.
2.1 Programme highlights this
period
2.1.1 Internal
Emissions
This year marks the end of a
three-year Toitū CarbonReduce programme. We have developed our
understanding of our carbon emissions, begun our path toward reduction, and
identified future challenges. The Bay of Plenty Regional Council’s
current total carbon emissions are 1,114 tonnes per annum. Since 2019, our
total carbon emissions have dropped by 8.3%.
Initially, our total carbon
emissions for this latest period were projected to show a reduction of 19% from
2019; however, heavy rainfalls in winter 2022 increased our energy demand to
power land drainage and flood pumps, driving emissions up unexpectedly. Work is
now underway to investigate transitioning pumps from diesel to electricity by
the end of 2023 (Figure 1).
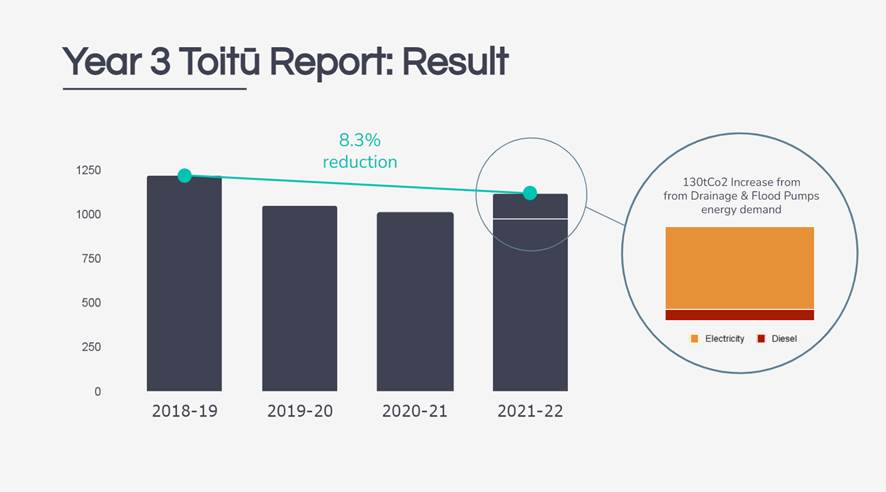
Figure 1: Summary of Emissions for Year 2018-22
Current actions to achieve net zero
carbon by 2050 are:
Monthly Carbon Emission Monitoring - We now monitor our emissions monthly for each business unit and
office. Gaining regular feedback on our effort allows for a more agile approach
to reducing emissions.
Fleet Optimisation Study - Our Council car fleet is becoming increasingly electrified with
21 electric vehicles now in use, or 14% of the fleet. However, vehicle
emissions remains our main carbon emitter. An optimisation study will highlight
emissions reduction opportunities through short-term responses and long-term
planning. The first of 3 deliverables have been received from our consultant,
and the results and next steps are due in early March 2023.
Sequestration/Insetting
As an initial step in consideration of sequestration opportunities,
BOPRC has engaged EKOS to assess the eligibility[1] of completed and planned re-vegetation in the Pāpāmoa
Hills Cultural Heritage Regional Park (Figure 2) under the Emission Trading
Scheme (ETS). Subject to the outcome of this assessment, staff would seek a
decision from the Council on registering these areas under the ETS.
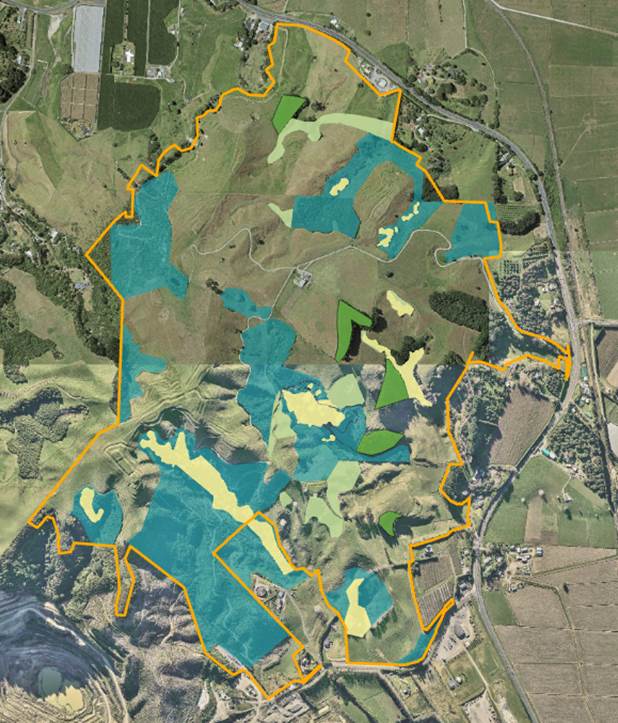
Figure 2: Papamoa Hills
Cultural Heritage Regional Park re-vegetation plan
Sequestration opportunities in the region’s regional
parks are limited due to the cultural and archaeological values present. Te
Uepu, the co-goverance entity for Pāpāmoa Hills Regional Park, wish
to avoid the blanket planting of the park. Council will need to look outside
the existing two regional parks for further significant insetting
opportunities.
Future thinking: Establishment of a
Pathway to Net-Zero
Initial thinking on a strategic approach
to net zero is underway. As Council emissions will never be zero, an early
carbon sequestration approach, compensating for emissions that cannot be
eliminated will need to be developed. This could include options that hit
multiple objectives and outcomes. Staff will bring this discussion to Council
through the Strategy and Policy Committee and next Long Term Plan development.
2.1.2 Blue Carbon
building blocks
Phase 1 - Saltmarsh Mapping
The assessment and mapping of
potential saltmarsh habitat restoration sites in the region has been completed
and reported as an environmental publication (Crawshaw & Fox, 2022) [2]. This mapping is part of a Climate
Change Action Plan project exploring the potential of Blue Carbon in the
region, along with future work to validate local carbon sequestration rates of
saltmarsh.
Saltmarsh
habitats provide a range of ecosystem services, including carbon storage, and
are culturally significant to Māori. Historically the Bay of Plenty has
lost 60% of its saltmarsh habitat to reclamation, with the majority lost in
Tauranga Harbour and Waihī Estuary (Park 2000). Restoration of saltmarsh
habitat is a key goal for regional council, to meet regional and international
obligations. We have undertaken a regional assessment of elevation profiles of
coastal land to identify potential locations for undertaking saltmarsh
restoration projects, which will support biodiversity restoration and water
quality outcomes, and carbon sequestration.
LiDAR, field
surveys and aerial imagery identified that the preferred elevation range for
saltmarsh occurs between 0.8 m–1.2 m Moturiki RL. We used this elevation
range and the regionwide LiDAR dataset to identify all land that falls within
this elevation range as “potential saltmarsh habitat”. There is
currently 1,416 hectares of existing saltmarsh mapped across the Bay of Plenty,
with the majority being located in Tauranga and Ōhiwa Harbours.
There was 4,888
hectares of land identified within the “potential saltmarsh
habitat” range, with 3,288 hectares of this currently in pastoral land
use. The maps are intended to be used by land management officers to undertake
site specific investigations and support conversations with landowners, as a
first step to identify the potential for saltmarsh restoration at scale in the
Bay of Plenty.
Future sea
level rise scenarios were also mapped, which indicated potential migration
pathways for saltmarsh habitat to move inland as sea levels rise, to future
proof new restoration projects. There is likely to be an overall decrease in
space available for saltmarsh with sea level rise due to land topography,
although there will be gains and losses in different areas.
Phase 2 -
Wetland carbon sequestration study
‘Blue carbon’ refers to carbon
captured by the world’s ocean and coastal ecosystems. Blue carbon
projects focus on restoration of coastal ecosystems with the aim of reducing
greenhouse gas emissions, and/or enhancing the removal of these gases. This can
be achieved by re-wetting and revegetating tidal wetlands or preventing intact
tidal wetlands becoming degraded.
Australia has developed a Blue Carbon Method
which provides landholders with incentives to undertake blue carbon projects.
Projects are awarded Australian Carbon Credit Units, which can be sold to the
government or others interested in offsetting emissions. There is potential for New Zealand to develop
its own Blue Carbon Method to help incentivise blue carbon projects here.
Before a blue carbon method could be developed
for New Zealand, a
blue carbon accounting model would need to be developed. This would model emissions avoided from prior land use and carbon
sequestered in biomass and soils, with different values used for different
climatic regions and for different types of coastal wetland (e.g. mangroves,
saltmarsh, seagrass, etc).
A literature review by EKOS (2022) found
there is very little data available on carbon storage and emissions within
intact coastal wetlands in New Zealand, and a knowledge gap regarding degraded
habitats and those
in various stages of restoration. Saltmarsh is one coastal wetland type for
which there is a paucity of data; there are no published data on emissions for
saltmarsh and only a single published study (from a single estuary) for carbon
storage.
This project aims to increase knowledge of
carbon storage from coastal wetlands in Bay of Plenty with the aim of providing
data which will be important in the development of a blue carbon method for New
Zealand. Our initial focus will be on saltmarsh habitats as this is a key focus
for biodiversity driven restoration efforts in our region.
In the 2022/23 financial year we will
focus on increasing staff knowledge and skills in blue carbon coring methods
and on collecting cores from 1-2 intact saltmarsh sites. Further sites will be
sampled in 2023/24 to increase our understanding of variability in carbon
storage across intact saltmarsh sites.
This work will compliment carbon
sequestration studies being undertaken in restoration sites such as Wainui Repo
Whenua (Sargent Drive) by University of Waikato; and within Nukuhou (Ōhiwa
Harbour) and Athenree (Tauranga Harbour) saltmarshes as part of the Future
Coasts Aotearoa (Future Coasts Aotearoa | NIWA).
Future thinking
As the building blocks: potential
saltmarsh habitat, sequestration rates, and blue carbon methodology are
developed; there is potential for a discussion of a new programme of work in
the development of the next long term plan to seize this opportunity.
2.1.3 Tourism Bay of Plenty Low Carbon
Programme
The second
tranche of local tourism operators has graduated from the 12-week ‘Green
Room’ programme. This LTP funded project focuses on assisting local
tourism operators to turn aspirations into reality for a more sustainable
tourism sector. The goal is for 100 businesses to go through the programme. The
programme is well connected to and supported by the tourism Industry.
In
Waihī Beach and Katikati 17 organisations have graduated. In Tauranga, 11
organisations graduated and a further 12 organisations are currently underway.
Planning is underway to run a cohort in Whakatāne.
Tourism Bay of Plenty will present to the committee on this
project.
2.1.4 Carbon Footprint
The Bay
of Plenty Community Carbon Footprint has been updated covering the three years
2018/19, 2019/20, 2020/21 and the summary report is available on our website.
Separate reports and data have also been provided to each of our Territorial
Authorities (including Taupō). The carbon footprint was calculated using
the standard Global Protocol for Community Scale Greenhouse Gas Emissions
Inventory (GPC) methodology, used by councils across New Zealand.
In
2020/21, Bay of Plenty gross emissions (excluding forestry) were 5,538 ktCO2e,
with agriculture and transport the largest contributors (Figure 3). Net
emissions (including forestry) were 7,162 ktCO2e, as over this period, forestry
was a net emitter due to the cyclical nature of the harvesting and planting
regimes.
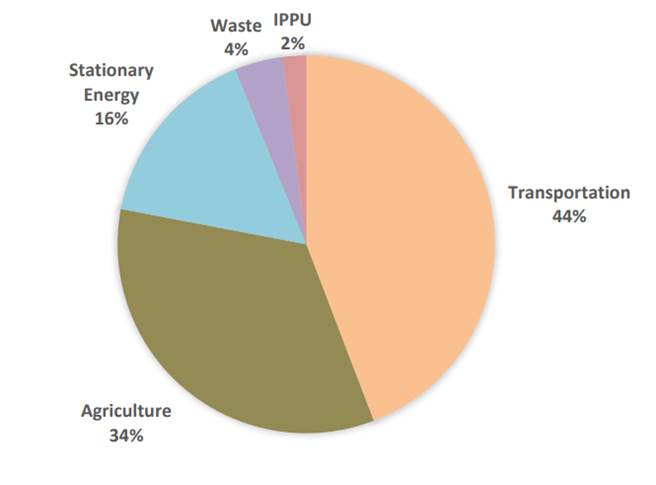
Figure
3: Bay of Plenty total gross GHG emissions in 2020/21, split by sector (tCO2e)
Figure 4
shows the changes in the five year period since the last carbon footprint
(2015/16), over which time our region’s gross emissions have increased by
12%. The main areas of growth have been in stationary energy (30% increase) and
transport (28% increase).
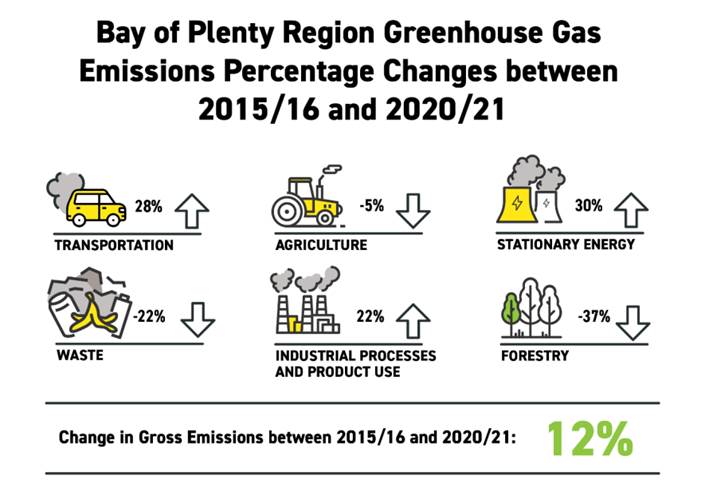
Figure 4: Change in Bay of Plenty’s Emissions
between 2015/16 and 2020/21
The
updated footprint provides the region and our districts with a current baseline
of emissions across a range of sectors: stationary energy, transport, waste,
industrial processes and product use, agriculture and forestry. This can help
identify where emissions reduction efforts need to focus and form the basis of
conversations across sectors and communities about the actions required to
reduce our collective carbon footprint. The regional pilot of the Future Fit
carbon footprint tool, at an individual level, and the Regional Energy
Transition Accelerator, at a sector level, as presented to the Strategy and
Policy Committee on 14 February, are initiatives to support the reduction of
regional emissions.
2.1.5 Regional Risk Assessment
Context
Council has undertaken a regional climate
risk assessment, through Tonkin and Taylor and this work is currently
completing. The risk assessment follows the development of regional climate
projections from NIWA and relates to the Council position statement to raise
awareness of anticipated climate impacts and leadership in response. The risk
assessment follows national guidelines and it also incorporates a Te Ao
Māori lens through a dedicated working group and case studies - this is a
Toi Moana initiative. The process has involved identifying a long list of risks
through surveys, workshops and online hui, which have then undergone a
technical risk assessment through a series of workshops with subject matter
experts.
Outputs
The Regional Climate Change Risk
Assessment provides a regional
overview of climate risks in order to identify and highlight areas where a
focused effort is needed to manage these risks. The
outputs from this assessment:
· establish a
common baseline for the region,
· support
planning by a range of parties,
· raise
community awareness of risk,
· support
subsequent detailed local risk assessments.
Next Steps
The completed risk assessment
will be presented at the upcoming S&P workshop 28 March 2023, and the
guidance sought on use of the assessment.
2.1.6 Community Led Adaptation Funding
The first Community-led Adaption
(CLAF) project has been completed with the Maketū Climate Change Adaption
Plan now finalised. The development of this plan was led by the Maketu Iwi
Collective and developed with and by the community. This was the first of six
projects funded through Council’s Community-led LTP initiative. The Maketū
Adaptation Plan has been nominated for the non-statutory best practice award
for the New Zealand Planning Institute Annual Awards.
Round Three completed - The third round of CLAF funding closed on 31 October with three
applications received. After applications were assessed against the funding
purpose and criteria, one project was approved.
· Te Rūnanga o Ngāti Ranginui has been approved $15,000
(subject to contract) to carry out a Climate risk assessment on their 3 most
vulnerable Marae to support adaptive planning within the rohe of
Ngāti Ranginui.
This project
brings the total to six projects now being funded through Councils CLAF.
Applications
for funding are now open on an ongoing basis until the end of the financial
year. For more information please see the BOPRC website.
2.1.7 Sustainable Homes Scheme
As of December 2022, BOPRC has helped 103 low income
households throughout the region to upgrade to lower emission and energy
efficient heating. This was achieved through the Sustainable Homes Scheme
grants, in partnership with other funders. As part of LTP 2021-31, $200,000
(excl GST) was earmarked for these grants. As of December 2022, $64,500 has
been used.
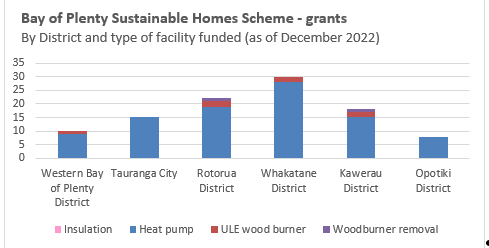
Figure
5
Note - The loan component of the Scheme (for clean
efficient heating, solar power and insulation) is on hold pending an exemption
from the Credit Contracts and Consumer Finance Act 2003. At the end of 2022,
MBIE advised BOPRC that the Minister of Consumer Affairs, was keen to explore
the option of a wholesale exemption for local government.
3. Considerations
3.1 Risks and Mitigations
Climate change is listed on
Council’s Key Risk Register, due to the impact this will have on our
council’s decision-making processes over the longer term. An internal
audit review of the climate change programme will take place in the calendar
year 2023.
3.2 Climate Change
The Climate Change Programme
delivers, monitors, and reports on Council’s response to climate change
in terms of priorities and actions around both mitigation and adaptation.
3.3 Implications for Māori
Climate change could potentially have significant
impact on hapū and iwi in the region. Many marae in the Bay of Plenty
region are located in coastal or low-lying areas, potentially exposed to
flooding and coastal hazards.
The economic livelihood of many of the region’s
iwi are linked to natural resources, through activities such as farming,
forestry, aquaculture & tourism. These sectors may be impacted by the
forthcoming national Emissions Reduction Plan and associated carbon budgets, as
well as being potentially vulnerable to ecosystem changes caused by climate.
Our regional climate risk assessment process is helping
to tease out both local Māori perspectives on climate change along with
more specific risks. The funding we are providing for community adaptation
planning (Action Plan project 14) is supporting hapū and iwi to develop
their own climate change understanding and response.
Climate change is beginning to be identified
specifically in iwi management plans with the inclusion of natural hazards as a
key topic. Providing accessible and useful information around the climate
impacts and hazard risks for the region through our climate change story maps
(Action Plan project 17) will help to inform the response by iwi and hapū.
The Community led adaptation
funding has been exclusively accessed by hapū and iwi, demonstrating the
readiness and concern that exists around climate change.
3.4 Community Engagement
1
|

|
INFORM
Whakamōhio
|
To provide affected communities with
balanced and objective information to assist them in understanding the
problems, alternatives and/or solutions.
|
Engaging with our community around climate change and
encouraging action related to climate change is a core part of our climate
change work programme. The Community led adaptation funding, low carbon
tourism, and sustainable homes projects all have an element of community
engagement.
3.5 Financial Implications
There are no
material unbudgeted financial implications, and this work all fits within the
current budget.
4. Next Steps
The Climate Change Programme will report back to Council
quarterly along the following lines
· Monitoring
& Operations: a quarterly update of progress and delivery of specific
climate change projects, as detailed in the Climate Change Action Plan.
· Strategy
& Policy: these reports will detail the strategic issues and decisions
required, along with new and emerging initiatives.
Attachments
Attachment 1 - Climate Change Programme Overview February 2023 ⇩
Monitoring
and Operations Committee 7 March 2023
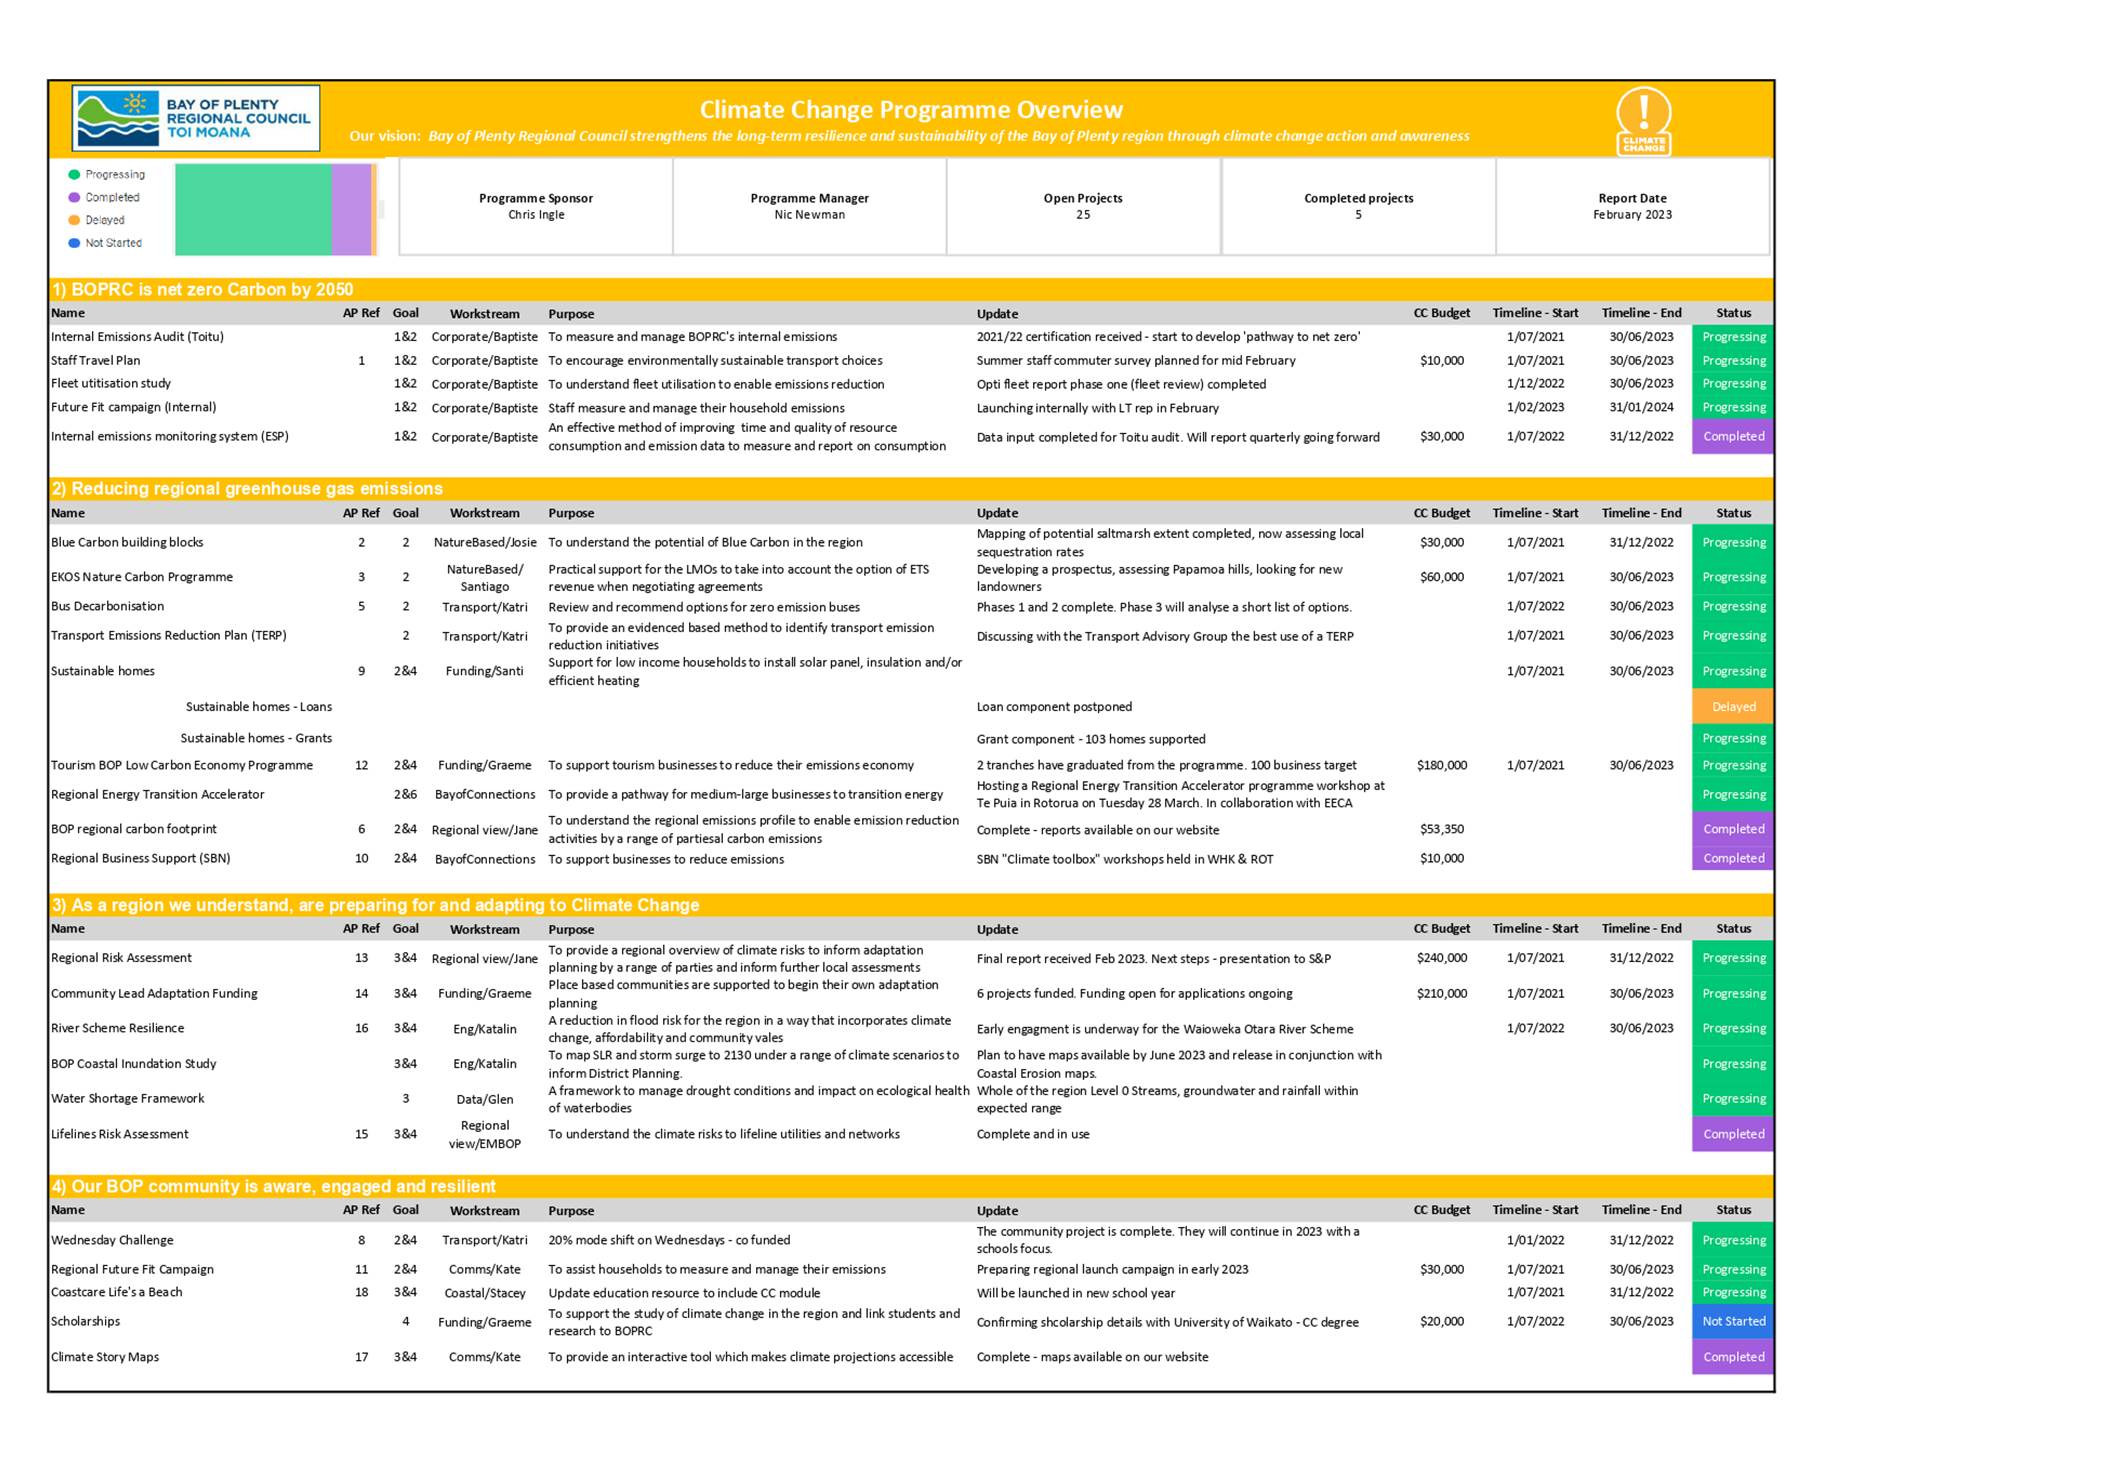
|
|

|
|
|
|
Report To:
|
Monitoring
and Operations Committee
|
|
Meeting
Date:
|
7 March
2023
|
|
Report
Writer:
|
Alex Miller, Compliance Manager -
Land & Water
|
|
Report
Authoriser:
|
Reuben
Fraser, General Manager, Regulatory Services
|
|
Purpose:
|
|
|
|
|
2021/2022
Compliance Activity Report
|
Executive Summary
This report provides the Committee with an overview of the Regulatory
Compliance Activity for the 2021/22 year, including:
· 3,179 site inspections on 3,173
resource consents were undertaken, and 12,609 performance monitoring returns
from consent holders were reviewed. These site inspections showed that 79%
were complying with their consents, and only 1% were in significant
non-compliance. This is a slight decrease from 84% in 2020/21, but remains
consistent with historical averages, and national statistics.
· Regional Council issued 117
abatement notices, 51 infringement notices, and received decisions from the
court in relation to six matters, resulting in a total of $279,500 in fines,
and a range of other sanctions and outcomes.
· 3,169
calls were received and responded to through the Pollution Hotline, which is 602
fewer than the previous year.
|
Recommendations
That the Monitoring and Operations Committee:
1 Receives the report, 2021/2022 Compliance Activity Report .
1. Introduction
The Bay of
Plenty Regional Council (Regional Council) uses a variety of regulatory and
non-regulatory tools to manage the environmental impacts of activities
throughout the region, including rules made and resource consents issued under
the Resource Management Act 1991 (RMA). Compliance with the requirements of
these rules and resource consents provides an important measure of how we, as a
regulatory authority, engage with the community to manage environmental
impacts.
This report
provides a brief summary of Regional Council’s compliance, monitoring and
enforcement activity through the 2021/2022 year.
1.1 Legislative
Framework
The Regulatory Compliance
function primarily operates as a core council requirement under the Resource
Management Act; which sets out an obligation for Regional Councils to monitor
and enforce compliance with the Act and any associated instruments (eg. NES),
Regional plan rules and resource consents.
There is some crossover with
other legislation through activities such as incident response and enforcement
proceedings.
1.2 Alignment
with Strategic Framework
|
A Healthy Environment
|
We
develop and implement regional plans and policy to protect our natural
environment.
|
|
Freshwater for Life
|
Good
decision making is supported through improving knowledge of our water
resources.
|
|
The Way We Work
|
We
provide great customer service.
|
1.2.1 Community
Well-beings Assessment
|
Dominant Well-Beings Affected
|
|
þ Environmental
High -
Positive
|
þ Cultural
Medium
- Positive
|
¨ Social
|
¨ Economic
|
2. Compliance
Monitoring
2.1 Overview
Compliance
monitoring is an important tool for ensuring that consent holders and members
of the public are undertaking activities in the correct manner, and complying
with the conditions of any applicable resource consents or Regional Plan rules.
Consented
activities are monitored through a combination of site inspections and desktop
performance monitoring, which involves the review of data and reporting
provided by consent holders.
The frequency
for site inspections is determined according to a range of factors, including
the nature, scale, and environmental risks associated with the activity. This
frequency is reviewed annually and outlined in Council’s RMA and Building
Act Charges Policy.
The frequency
for performance monitoring is considered during the consent application
process, and set out in the conditions of a resource consent.
2.2 2021/22
Compliance Monitoring Results
Throughout
2021/22, Regional Council undertook 3,719 site inspections on 3,173 resource
consents, and reviewed 12,719 performance monitoring returns from consent
holders.
Compliance
results for site inspections showed that 79% of were complying with their
consents, and only 1% were in significant non-compliance. This is a slight
decrease in compliance from the previous year (84%) although remains consistent
with numbers seen in previous years and across other regions.
Of the 12,719
Performance Monitoring returns assessed, 83% were found to be compliant, which
is consistent with the previous year. The majority of non-compliance was considered
to be low risk, with 144 (1%) significant non-compliances identified.
The most
frequently monitored activities were earthworks, dairy effluent discharges, and
water takes. This is consistent with previous years, and reflects both the
environmental risks associated with these activities, and the volume in which
they occur within Bay of Plenty Region.
A number of
other activities, such as major infrastructure and industrial facilities, can
also present a significant risk and are inspected regularly; however, these are
fewer in number, and often have a more significant reliance on performance
monitoring.
Compliance
results for dairy effluent discharges (63%) were poorer than last year, which
continues a trend of decreasing compliance levels observed over the last five
years (refer to Table 1). Key issues this reporting period were effluent
management and ponding, which was exacerbated by the wet winter season.
Although the majority of issues were considered to be low risk, a number of
moderate and significant non-compliances were identified and referred to our
investigations team for further enforcement.
Performance on
earthworks sites remained strong with 83.5% compliance across all inspections;
this reflects the significant effort that has been put into monitoring earthworks
sites and industry engagement and education, particularly in high-risk and/or
intensive development areas in the Western Bay of Plenty.
In recent
years, Council has increased focus on consented water use and promoted the
uptake of telemetry, in line with the 2020 amendments to the Resource
Management (Measurement and Reporting of Water Takes) Regulations 2010. This
results in a significant volume of data coming into Council which needs to be
reviewed and responded to where necessary. Staff are currently in the process
of developing various steps of automation to streamline the process.
A summary of
compliance results (inspections and monitoring) for high risk and/or priority
activities is provided in Table 1, below.
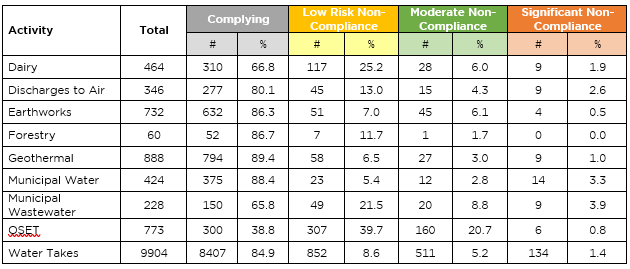
Table 1: Compliance Results for High
Risk/Priority Activities – site inspections and performance monitoring
The total
number of site inspections is approximately 23% less than the previous year;
however there has been a significant increase (+1,043) in the amount of
performance monitoring, which reflects the growing reliance on data for
compliance monitoring.
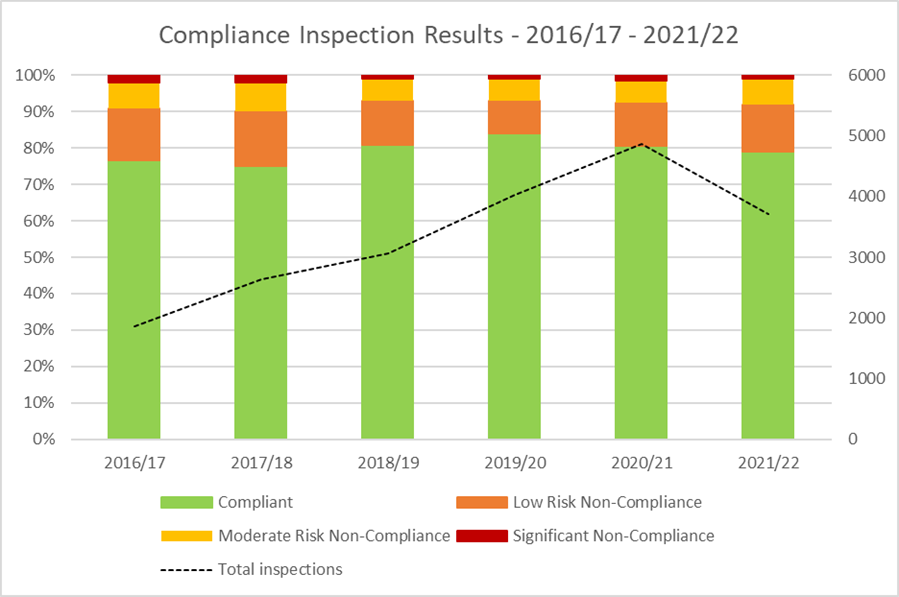
3. Permitted/Unconsented
Activity CME
At the request of Regional Council, resourcing was
provided through the current Long Term Plan to enable proactive compliance
monitoring on a number of permitted and/or unconsented activities identified to
be high risk; specifically, earthworks, horticultural water use, and on-site
effluent treatment (OSET).
To date, this programme has resulted in 92 site
inspections for unconsented water takes (50), earthworks (30), and OSET (12).
The majority of these site visits were initiated from compliance staff analysis
of property information or surveillance of aerial imagery; very few (approx.
2%) were initiated from public contacting the BOPRC hotline.
Of the 92 inspections, approximately 33% complied with
the respective permitted activity and no further action was required, and 33%
of sites were assessed to be non-complaint with the permitted activity. The
remainder of sites are being subject to further monitoring and investigation,
in order to determine whether or not they are complying with Regional Plan
Rules.
For those non-compliant with the permitted activity
rules, enforcement was initiated for 19 of the 32 sites to date in the form of
abatement and/or infringement notices; in most cases this has been sufficient
to prompt landowners to cease offending, as either the site changes the way
they undertake the activity to meet the permitted activity standards, or they
gain resource consent to authorise the activity.
A number of sites were considered to be significantly
non-compliant; this has resulted in three prosecutions commenced, all of which
are currently before the courts, and two further investigations currently
underway.
4. Enforcement
In 2021/2022,
Regional Council Received decisions from the court in relation to six matters,
resulting in a total of $279,500 in fines, and a number of other sanctions;
refer to Table 2, below. As of 15 February 2023, six cases remain before the
courts.
|
Matter
|
Summary
|
|
BOPRC v. CPB Ltd
|
On 16 July
2021, Council received the final decision from Judge Dwyer in relation to
BOPRC v. CPB Contractors Pty Ltd. This case was in relation to a discharge of
wastewater, which occurred after works associated with the Bayfair to Baypark
Link project struck a sewer line. The wastewater discharged into the TCC
stormwater network, and surface water, which ultimately drains to Tauranga
Harbour. CPB pleaded guilty and were fined $63,000. In addition to the
penalty issued by the courts, CPB engaged with tangata whenua to apologise
for the incident and committed to an environmental restoration project
downstream of the discharge.
|
|
BOPRC v. Rotorua District Council
|
On 19
November 2021, Council received a decision from Judge Smith in relation to
BOPRC v. Rotorua District Council, which was a prosecution in relation to
discharges of leachate contaminated stormwater from the Rotorua Landfill in
2017, which reached the Tureporepo Stream, a tributary of the Puareanga
Stream, which drains to Laka Rotorua. This matter was subject to significant
litigation and was originally set down for a trial by jury, before Rotorua
District Council pleaded guilty in May 2021. Rotorua District Council were
convicted, fined $60,000 (discounted from a starting point of $100,000), and
ordered to pay $80,000 in reparations to a trust comprised of affected mana
whenua.
|
|
BOPRC v.
Kleadmak Farms Ltd
|
On 25 January
2022, Council received a decision from the Court for the matter of BOPRC v.
Kleadmak Farms - a prosecution in relation to the grazing of pigs in the bed
of the Umurua Stream, a tributary of the Ngongotahā catchment, which was
identified through a complaint received in October 2020. Kleadmak farms pleaded
guilty to the charges and agreed to an enforcement order in relation to stock
exclusion and removal of the pigs from the property as part of the sentencing
process. Judge Smith chose to convict and fine Kleadmak $27,000.
|
|
BOPRC v CRS Ltd
|
On 4 February 2022, Council received a
decision from Judge Dickey in relation to BOPRC v. CRS Ltd, which was a
prosecution in relation to discharges of sediment-contaminated stormwater
from a container storage site in Mount Maunganui, which reached Tauranga
Moana at Waipu Bay. This was the second time Council has prosecuted CRS for
discharges of this nature. CRS pleaded guilty and engaged in a restorative
justice process with Ngāi te Rangi and Ngāti Kuku; although parties
were unable to reach agreement on appropriate reparations through mediation.
CRS were convicted and fined $49,000 (discounted from a starting point of
$70,000). In addition to the fine, CRS have lodged a formal undertaking with
the court which commits them to $50,000 of environmental enhancement work at
Whareroa, should Ngāi te Rangi and Ngāti kuku wish to accept it. As
a result of the two prosecutions, and other enforcement undertaken by
Council, CRS have now sealed their site, which will significantly reduce the
risk of similar discharges occurring in the future.
|
|
BOPRC v. Tio Faulkner
|
On 27
February 2022, Council received a decision from the court in relation to
BOPRC v. Tio Faulkner, which was a prosecution in relation to illegal
reclamation works in the coastal marine area on the Matapihi Peninsula,
discharges of effluent from a pig farm sited on the illegal reclamation, and
other associated charges. Following a week-long trial in July 2021, Mr
Faulkner was found guilty of the offences, and has subsequently been sentenced
to a prison term of three months and two weeks and ordered to pay a $5,000
contribution Council for costs associated with the prosecution. We understand
that Mr Faulkner has since lodged an appeal to the high court in relation to
this matter.
|
|
BOPRC v Waiu Dairy Ltd & Langford
Transport Ltd
|
On 10 March
2021, Council received a decision from the court in relation to BOPRC v. Waiu
Dairy Ltd and Langford Transport Ltd for the discharge of dairy factory
wastewater to a number of farms in the Bay of Plenty Region, from the Waiu
Dairy facility in Kawerau. Both parties pleaded guilty to the offences; Waiu
Dairy Lld were convicted and fined $49,000 for their role in producing and
disposing of the wastewater, while Langford Transport Ltd were convicted and fined
$31,500 for their role in carting and discharging the wastewater.
|
Table 2:
Prosecution Decisions Received in 2019/20
Regional
Council issued 119 abatement notices, and 51 infringement notices, totalling
$33,350 in fines. The majority of abatement and infringement notices related to
Section 15 offences (discharges of a contaminant).
5. Pollution
Hotline Response
The Pollution
Hotline is a 24/7 service for members of the community to report incidents and
pollution which may be in breach of consent conditions or regional plan rules.
In addition to providing an opportunity to identify and respond to incidents as
and when they happen, it provides a useful insight into community concerns,
particularly when these relate to permitted activities and/or emerging issues.
In 2019/20,
Regional Council received and responded to 2,834 calls through its Pollution
Hotline, which is almost 20% fewer than the previous year, and is the second
year in a row where numbers have dropped. This decline can likely be linked to
enforcement action and resolutions relating to major sources of complaints from
the public.
Outside of
business hours (weekends, and 4:30pm – 8:30am weekdays), the Pollution
Hotline is staffed with an on-call duty officer, in order to ensure that any
serious incidents are appropriately responded to as soon as possible; this is
particularly important for time-critical incidents, such as oil spills or
discharges to the environment. After-hours calls accounted for approximately
36% of calls to the hotline in 2021/22.
100% of service
requests were actioned within three days, with the majority (96%) responded to
within a day or less. 55 calls were classified as urgent, and attended to
within 12 hours.
Staff
physically attended 1,496 callouts, which is 47% of all calls. In responding to
service requests, Regional Council substantiated 789 breaches of consent
conditions and/or regional plan rules, which accounts for 25% of all calls, and
is slightly more than identified in 2021/22.
Similar to
previous years, the majority of calls (76%) related to air quality, with
approximately half of those being related to odour.
6. National
Benchmarking
For the last
five years, the Regional Sector Compliance and Enforcement Special Interest
Group (CESIG) has produced an annual report of compliance data collected from
Regional Councils and Unitary Authorities. The report is primarily for the
purpose of promoting consistency across the regional sector; it also provides
an opportunity to benchmark compliance performance in the Bay of Plenty,
compared to the rest of the country, at a high level.
As in previous
years, BOPRC is performing well against national benchmarks; monitoring 93% of
the required resource consents against a national average of 86%, and responded
to 100% of calls through to the pollution hotline, despite the disruptions from
Covid throughout 2021/22. From a volume point of view, both consents monitored
(3,173) and complaints responded to (3,169) are the second highest in the
country.
One of the more
interesting results this year was to see two cases before the courts resulting
in imprisonment, which has historically been very rare for offences under the
RMA. One of these cases was in the Bay of Plenty (BOPRC v. Tio Faulkner), with
the other being in relation to damage of wetlands in the Wellington region.
Compliance
levels in the Bay of Plenty are amongst the strongest in the country, with 79%
of consent monitoring resulting in “complying” grades (compared to
a national average of 73%), and only 1% being significantly non-compliant.
BOPRC numbers are notably higher than some of the councils of a similar size
and level of activity.
BOPRC is one of
the regions which has seen a substantial drop in the number of “active
resource consents” (-9.5%/-799); it’s expected that this is a
result of natural fluctuation in the types of activities occurring, and the
number of individual consent lines associated with some of the bigger suites of
consents (eg. major earthworks sites progressing towards completion).
7. 2022/23
Q1-2 Results
7.1 Compliance
Monitoring
From 1 July 2022-31 December
2022, Council has undertaken 1,912 compliance inspections, and reviewed 6,784
performance monitoring returns.
Compliance levels to date are
tracking similar to previous years, with 80% of inspections and performance
monitoring considered to be compliant, and a small number of significant
non-compliances.
The completion of the annual
dairy inspection project through spring 2022 provided an opportunity to
proactively check compliance with new permitted activities under the NES for
Freshwater, and gather further information on on-farm practices such as
intensive winter grazing. It also identified a continuation of a the trend of
worsening compliance for management of farm dairy effluent, with only 51%
of inspections identifying full compliance, and 5% considered to be
significantly non-compliant.
7.2 Service
Requests
In Q1-2 of 2022/23, 1222 calls
were received through our pollution hotline. Consistent with previous years,
over half of all calls to air quality, particularly odour (21%) and smoke
(21%), while discharges to water accounted for over 150 calls (12.6%).
Of the 1,222 calls, 302 (25%)
were confirmed to be breaches of Regional Plan rules and/or Resource Consents.
7.3 Enforcement
In the year to date we have
received decisions from the courts in relation to two discharges of plastic
matters, as outlined below:
· BOPRC v.
Whakatāne Mill Ltd: A prosecution in relation to two discharges of plastic
to the Whakatāne River. Whakatāne Mill Ltd pleaded guilty to the
offences; they were convicted and fined $35,625
· BOPRC v Kyle
Maitai: A prosecution in relation to the discharge of septic tank waste to land
where it entered the Orini Canal. Mr Maitai pleaded guilty to the charges and
was sentenced to 200 hours of community work, and a fine of $5,850.
Additionally,
Council has issued 153 abatement notices, and 16 infringement notices for a
total of $9,300 in fines.
8. Considerations
8.1 Risks
and Mitigations
The compliance function operates
in a number of high risk areas, both in terms of environmental risk
(particularly through the incident response function), and legal risk through
the enforcement function. Regional Council has a number of robust systems and
policies in place to manage and mitigate these risks.
8.2 Climate
Change
The matters
addressed in this report are of a procedural nature and there is no need to
consider climate change impacts.
8.3 Implications
for Māori
The Māori
population in the Bay of Plenty equates to about 28% of the total population.
BOPRC has clear statutory obligations to Māori under the Local Government
Act 2002 (LGA), and the RMA. In particular, Part 2, Sections 6 and 7 of the RMA
recognises and provides for participation in decision-making, having regard to
kaitiakitanga, consultation and fostering development.
Tangata whenua,
as kaitiaki, seek to protect the natural and physical environment, waahi tapu
and other sites of cultural significance to ensure community and cultural
sustainability is achieved. This aligns closely with the goals of compliance
monitoring and enforcement, and is considered in the day to day implementation
of our compliance programme.
In practical
terms, this may include ensuring tangata whenua are notified of incidents in
their rohe ("no surprises" approach), and seeking involvement in
projects where appropriate (eg. marae wastewater).We are also more actively
looking into opportunities to form partnerships to support shared goals and
outcomes.
He waka eke noa
– We’re all in this together.
8.4 Community
Engagement
|

|
Engagement with the community is not required as the report
is for information only.
|
8.5 Financial
Implications
There are no
material unbudgeted financial implications and this fits within the allocated
budget.
9. Next
Steps
The Regulatory Compliance group will continue to
investigate process improvements to ensure that the compliance monitoring
programme is implemented effectively and efficiently. Similarly, staff are
continuing to hone data over time to provide avenues for more proactive
approaches to encouraging compliance.
Priority focus areas in the future include
implementing the recently gazetted National Environmental Standard for
Freshwater, and continued work in the Air Quality space, as well as planning
for further changes through the development of new plans under the revised
National Policy Statement for Freshwater and wider RMA legislative reviews.
|
|
|
|
|
|
Report To:
|
Monitoring
and Operations Committee
|
|
Meeting
Date:
|
7 March
2023
|
|
Report
Writer:
|
Alex Miller, Compliance Manager - Land
& Water
|
|
Report
Authoriser:
|
Reuben
Fraser, General Manager, Regulatory Services
|
|
Purpose:
|
To provide an update on the
compliance performance for Municipal Wastewater Treatment Plants in the Bay
of Plenty Region
|
|
|
|
Overview
of Municipal Wastewater Compliance in Bay of Plenty Region
|
Executive Summary
This report
is an annual update to the Monitoring and Operations Committee on municipal
wastewater (treatment, conveyance, and discharge) in the Bay of Plenty
Region. There are 19 municipal wastewater treatment plants (WWTPs)
servicing communities across the Bay of Plenty.
There are a
significant number of challenges faced by Territorial Authorities in the
operation of their wastewater treatment plants, which can result in failure to
comply with their consent conditions. These challenges are experienced across
the region, with a number of non-compliances identified throughout the
2021/2022 financial year, ranging from low-risk or technical non-compliance
to significant non-compliance.
Network
overflows continue to be a challenge for Territorial Authorities; however,
the adoption of the best practice guide for the management of, and response
to overflows from wastewater networks has helped to drive improvements in the
quality and consistency of responses to such events.
Central Government is continuing to work through the three-waters
reform, which proposes changes to wastewater asset ownership and operation,
as well as oversight of regulation of wastewater activities.
|
Recommendations
That the Monitoring and Operations Committee:
1 Receives the report, Overview of Municipal Wastewater Compliance in
Bay of Plenty Region.
1. Introduction
The attached report is an update
on the current situation with regards to municipal wastewater (treatment,
conveyance, and discharge) in the Bay of Plenty Region.
There are currently 19 municipal
wastewater treatment plants (WWTPs) servicing the various communities spread
across the Bay of Plenty Region. There are a total of 37 resource consents held
by the Territorial Authorities (TAs) authorising the discharges from these
WWTPs. There are six TAs responsible for the operation of the WWTPs and compliance
with the resource consents.
Additionally, there is one WWTP
operated by a community organisation (Kāingaroa Village Inc).
1.1 Legislative
Framework
Compliance monitoring is a core
council requirement under the Resource Management Act, which sets out an
obligation for Regional Councils to monitor and enforce compliance with the Act
and any associated instruments (eg. NES), Regional plan rules and resource
consents.
Central Government is continuing
to progress reforms to the three-waters infrastructure sector, which has seen
the introduction of a new drinking water regulator, Taumata Arowai, and a
number of pieces of legislation to establish the new framework and entities
associated with the reform
In December 2022, the Water
Service Entities Bill, which provided for the establishment of four Water
Service Entities, was given royal assent. Through Department of Internal
Affairs, a National Transition Unit (NTU) has now been established to
facilitate the transition of three waters infrastructure from its current
owners, TA’s, to the new Water Service Entities. As part of this, all
relevant resource consents which Regional Council currently administers will
need to be transferred to the newly established Entity B.
Through Te Uru Kahika, the
Regional Sector is assisting with the planning for transition of consents,
providing information on compliance history and risks, and developing guidance
to ensure the regional sector takes a consistent approach for regulation of the
new entities.
1.2 Alignment
with Strategic Framework
|
A Healthy Environment
|
We
manage our natural resources effectively through regulation, education and
action.
|
|
Freshwater for Life
|
We
collaborate with others to maintain and improve our water resource for future
generations.
|
A strong regulatory oversight of
wastewater treatment plants and systems allows us to ensure we have a healthy
environment as we can pre-empt issues and work with Territorial Authorities to
solve problems relating to non-compliant discharges.
Collaboration and a good working
relationship with TAs and tangata whenua is important to ensure we take a
“no surprises approach”. The Regional Wastewater Management Group
allows us to share ideas across the region. TAs more experienced in some areas
can provide support to others.
1.2.1 Community
Well-beings Assessment
|
Dominant Well-Beings Affected
|
|
þ Environmental
High -
Positive
|
þ Cultural
Medium
- Positive
|
þ Social
Medium
- Positive
|
¨ Economic
|
2. 2021/22
Wastewater Infrastructure Performance
2.1 Compliance
performance
There are a significant number
of challenges faced by the TAs in the operation of their WWTPs, which can
result in failure to comply with their consent conditions. These challenges are
experienced across the region, with several non-compliances identified
throughout the 2020/2021 financial year, ranging from low-risk or technical
non-compliance to significant non-compliance. These challenges include:
· Increased
inflow due to more frequent high intensity rainfall events and increased
population during the summer months,
· Inflow and
Infiltration (I&I) into the pipe networks,
· Unforeseen
mechanical and electrical failures,
· Aging
infrastructure (both at WWTPs and wastewater reticulation),
· High
strength trade waste discharges
· Expected
permanent population increase, and
· A lack of
funding for upgrades and maintenance.
There were no TAs that were
fully compliant with their resource consents for the 2020/2021 reporting
period.
2.2 Network
Overflows
Network overflows can present a
risk to both the environment and the community. There are several factors that
can lead to an unauthorised network overflow, including blockage as a result of
wipes, congealed fat and roots. Whilst emergency discharges from WWTPs may be
provided for by resource consent, network overflows are neither permitted nor
consented. A Regional Wastewater Management Group, comprised of representatives
from all of the TAs, Toi te Ora and the Bay of Plenty Regional Council, was set
up in order to develop a best practice guide for the TAs to follow in the
reporting and management of overflows. The best practice guide
was finalised in November 2019 and has been adopted by all TAs to guide their
response to overflows.
Given network overflows are
uncontrolled events, they cannot be authorised as discharges under a resource
consent. Therefore adherence to the Guide, which includes maintenance and
proactive measures to avoid overflows occurring, is a critical component in
considering enforcement in relation to such discharges.
Throughout 2021/22, there were
202 network overflows across the region, which is significantly more than
previous years (103 in 2020/21 last year), which is expected to be a result of
significantly higher rainfall through the year, putting additional pressure on
networks through stormwater infiltration.
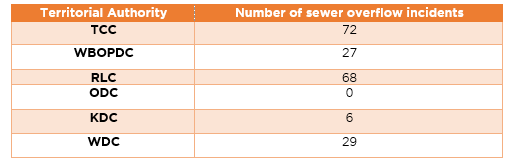
3. Considerations
3.1 Climate
Change
The matters
addressed in this report are of a procedural nature and there is no need to
consider climate change impacts.
However, the impacts of climate
change on wastewater infrastructure is a significant issue facing TAs,
particularly in low lying coastal areas. The Bay of Plenty
Lifeline Utilities Group (Emergency Management Bay of Plenty is a member) is
tendering for a full Climate Change Risk Assessment which will focus on
infrastructure, including the Three Waters. The outcomes will inform
adaptation by individual Lifeline Utilities (including TAs).
3.2 Implications
for Māori
Māori have identified
discharges of treated and untreated wastewater to water to be of concern,
particularly where that discharge is to freshwater. New consents such as the
Rotoiti/Rotoma WWTP have included pre-treatment in response to cultural impact
assessments developed by the relevant iwi and will use land treatment and
disposal methods. Other consents require the formation of Iwi Liaison and
Kaitiaki Groups.
Staff understand that the key aspects identified by
iwi include:
· The
transport of wastewater through and disposal of wastewater in separate rohe
· Active
involvement in monitoring both before and after the consent is granted
· Consultation
in the proposed WWTP design and disposal method
· Sharing
of information
· Up-skilling
of young people in environmental management and the RMA
· Introduction
of aspects of mātauranga Māori in monitoring and response to issues.
TAs are encouraged to notify
tangata whenua of network overflows, and each TA is currently developing their
own Iwi notification procedure following consultation.
3.3 Community
Engagement
|
|
Engagement with the community is not required as the this
report is for information only.
|
3.4 Financial
Implications
There are no
material unbudgeted financial implications and this fits within the allocated
budget.
4. Next
Steps
Council will continue to monitor TA’s compliance
with their respective consents relating to wastewater operations.
It is anticipated that the 2022/23 Wastewater
Compliance Report will be presented to this committee in September 2023
Attachments
Attachment 1 - Overview of WWTP Compliance in BOP Region February
2023_Final ⇩
Monitoring
and Operations Committee 7 March 2023

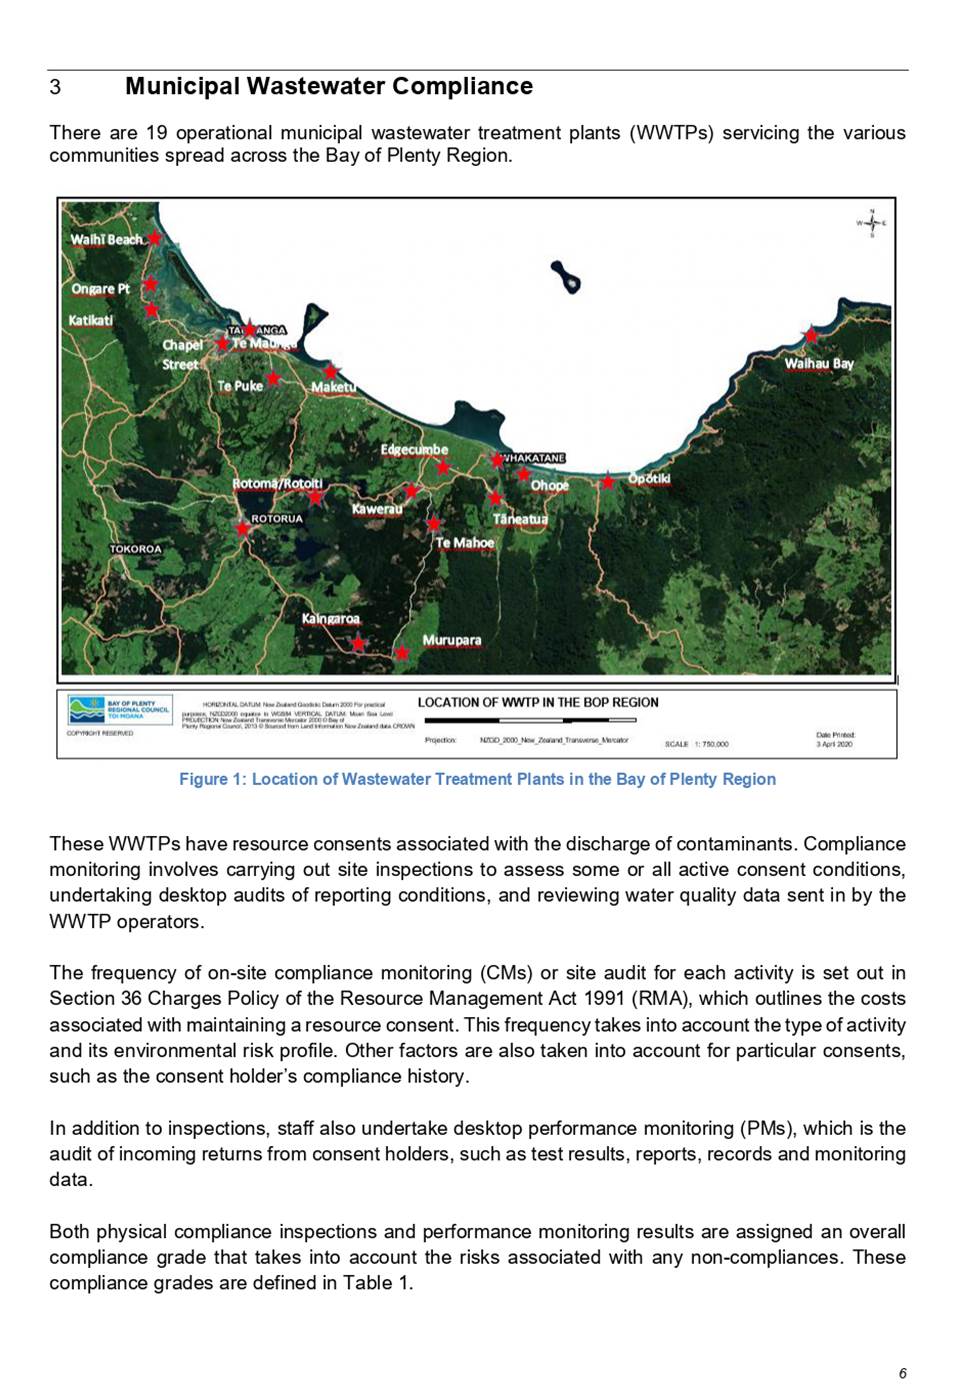
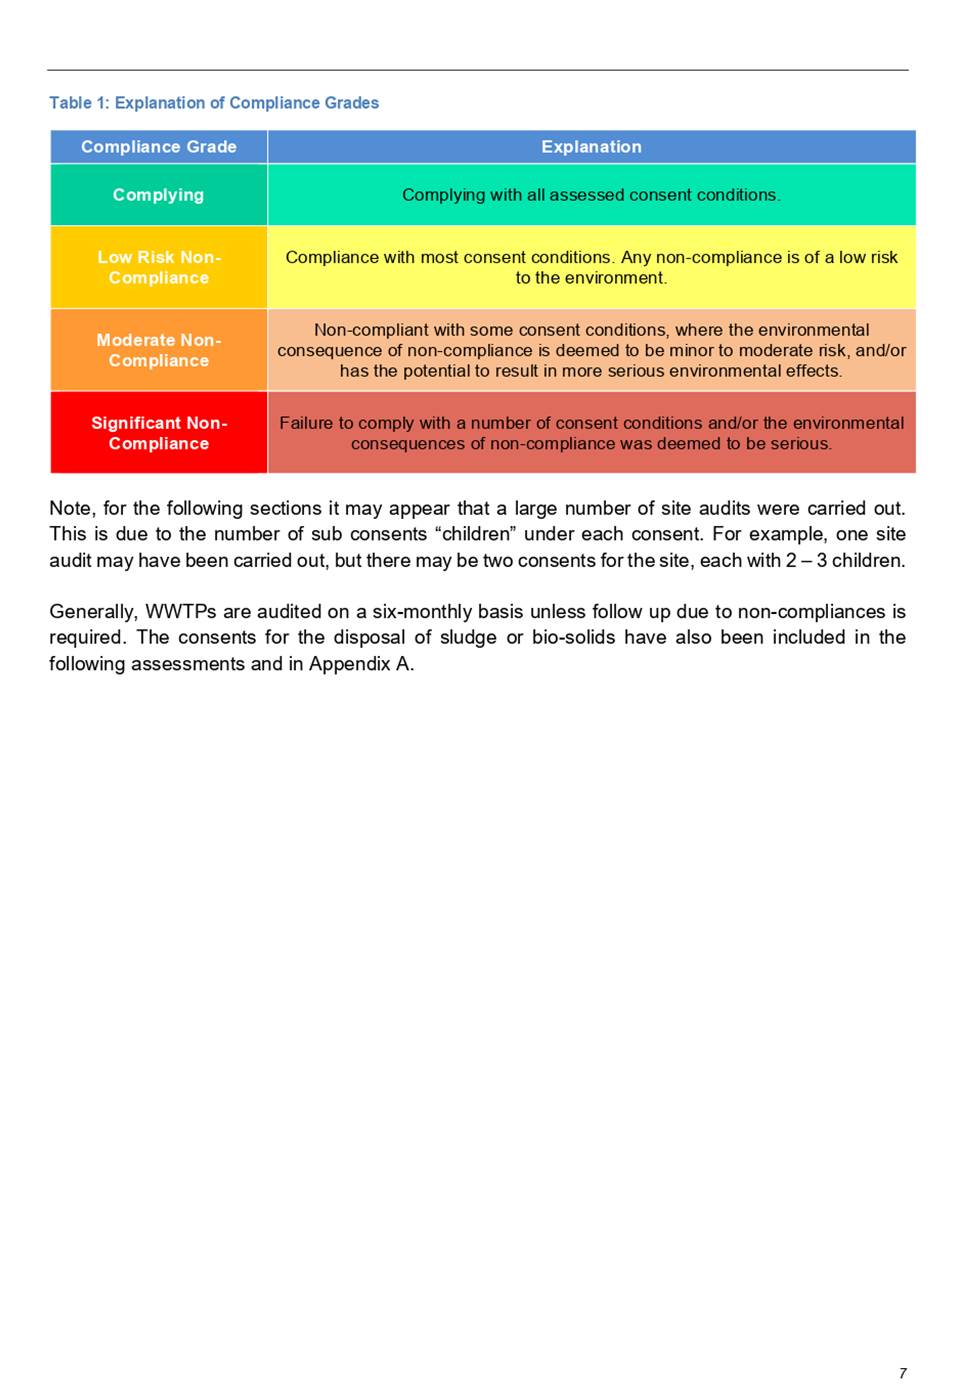
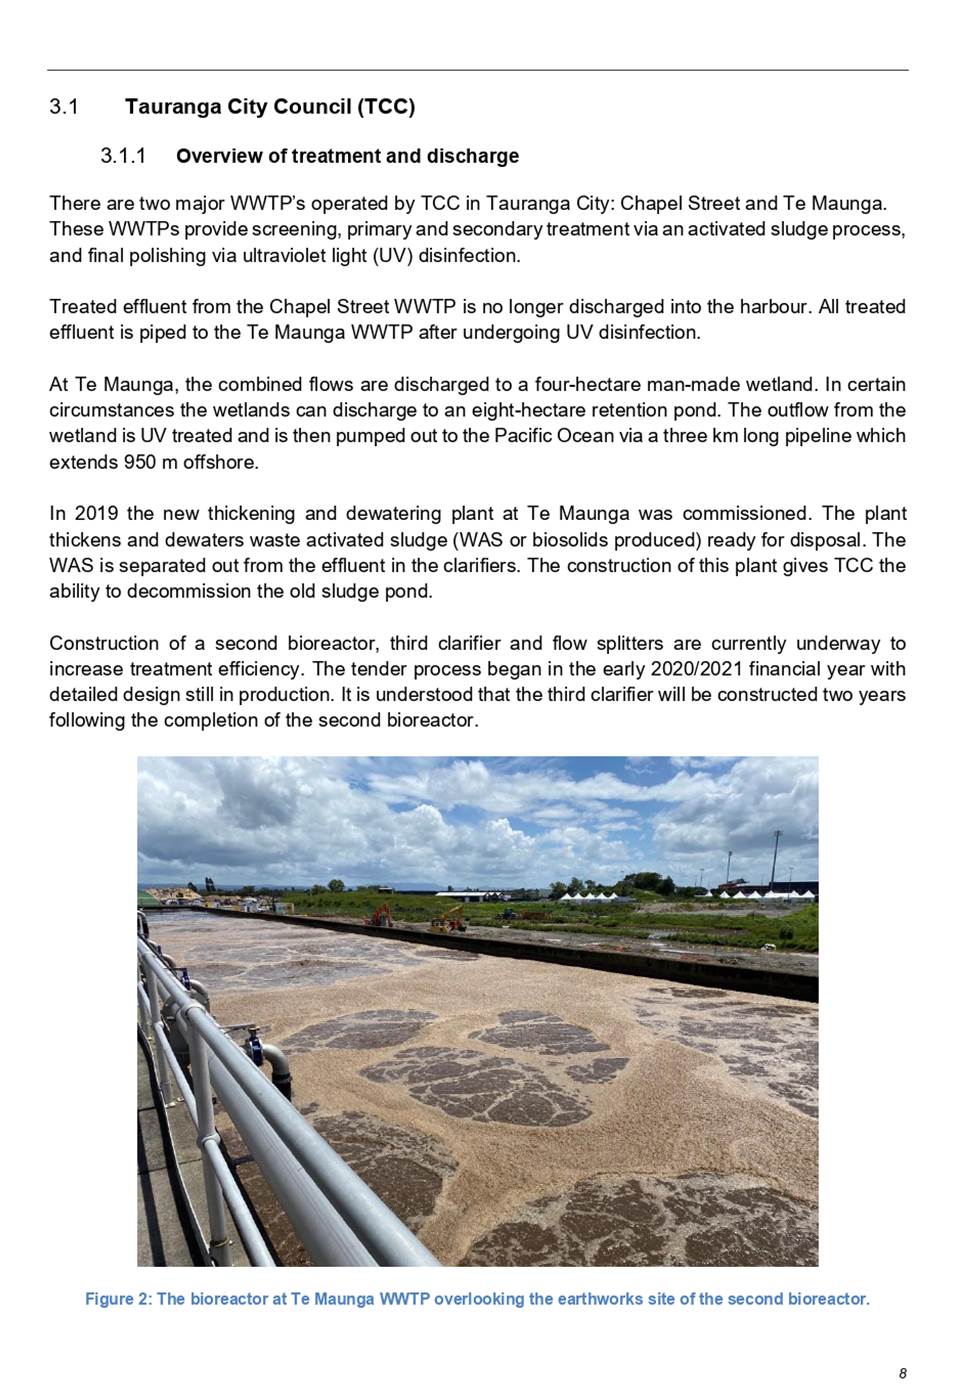
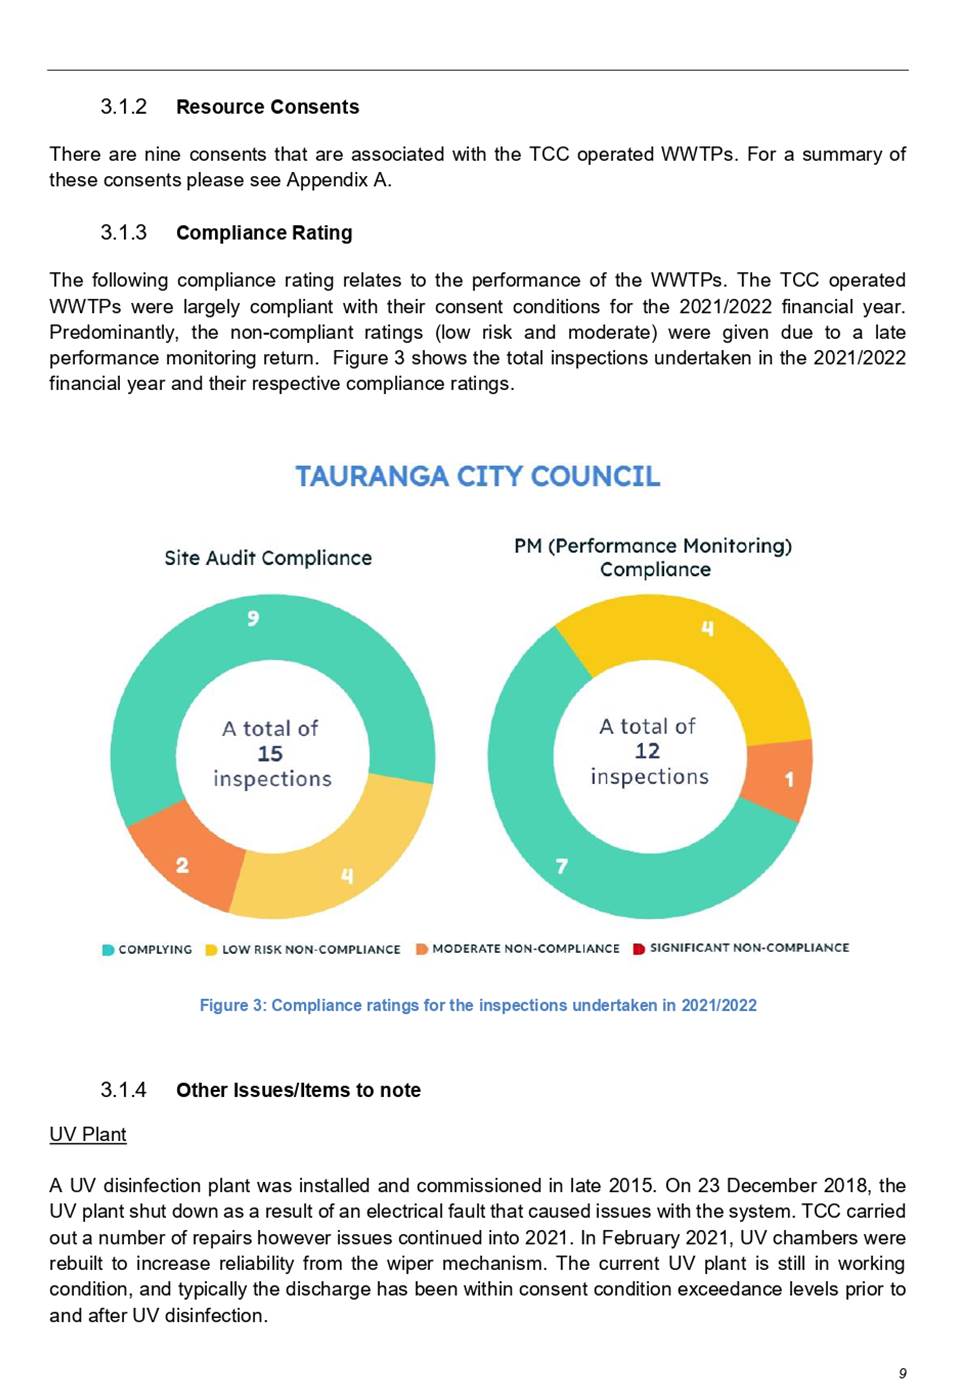
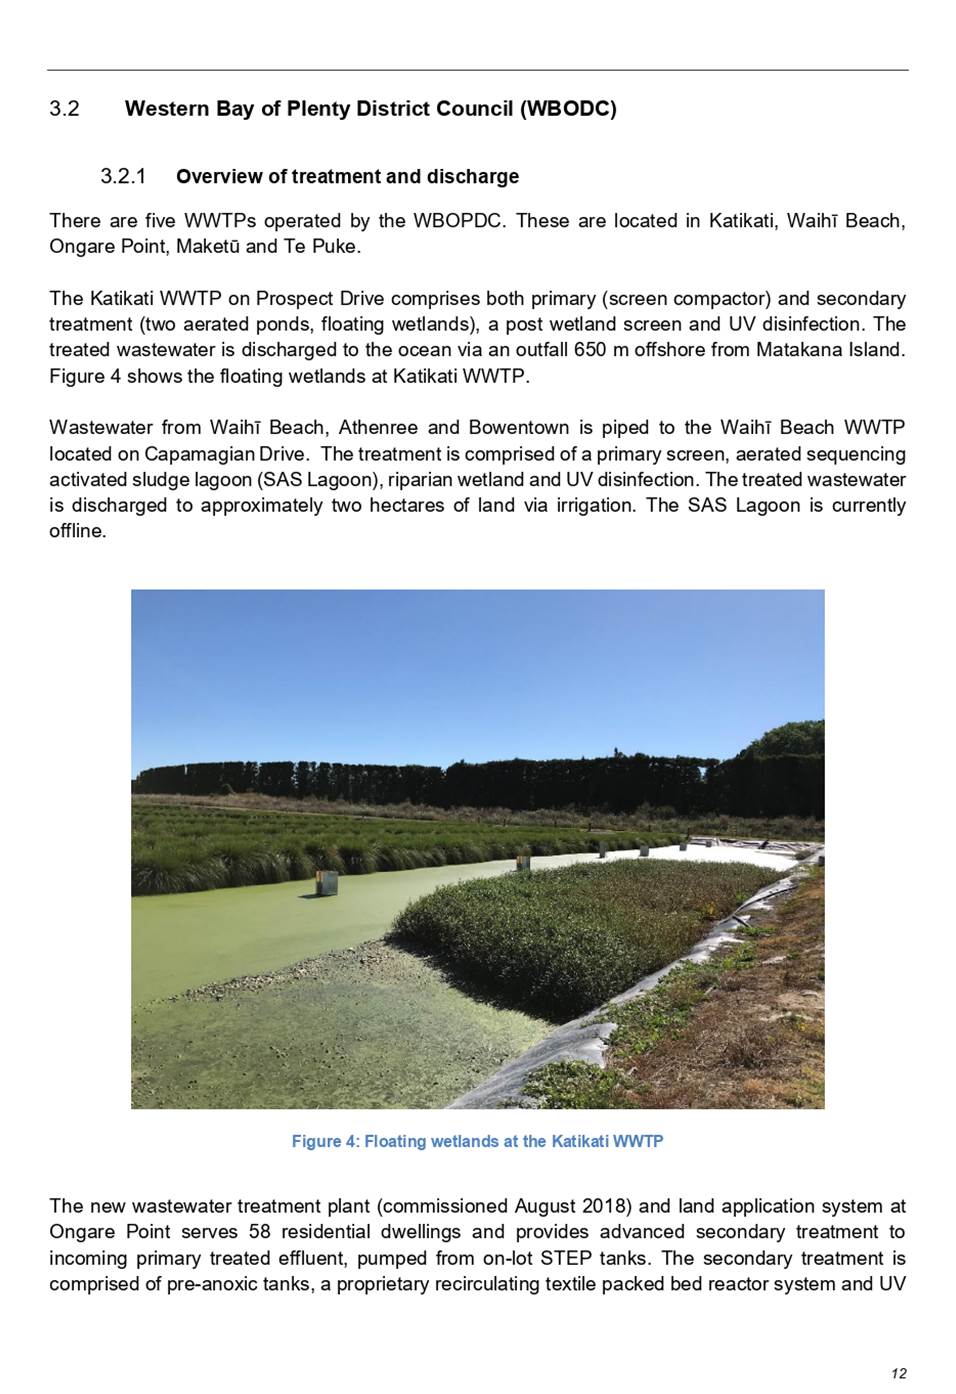
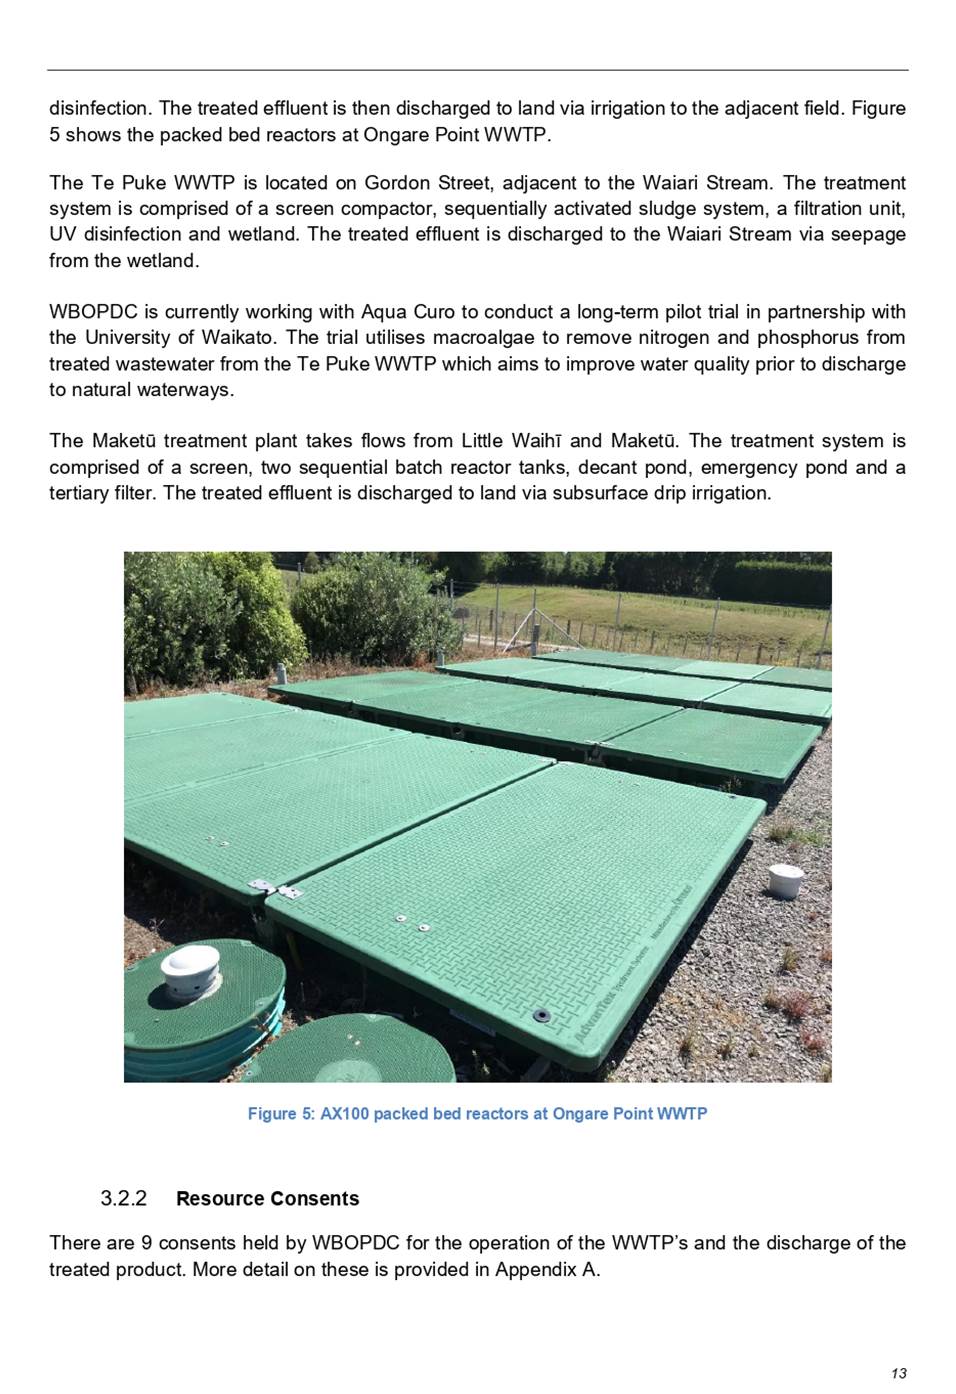

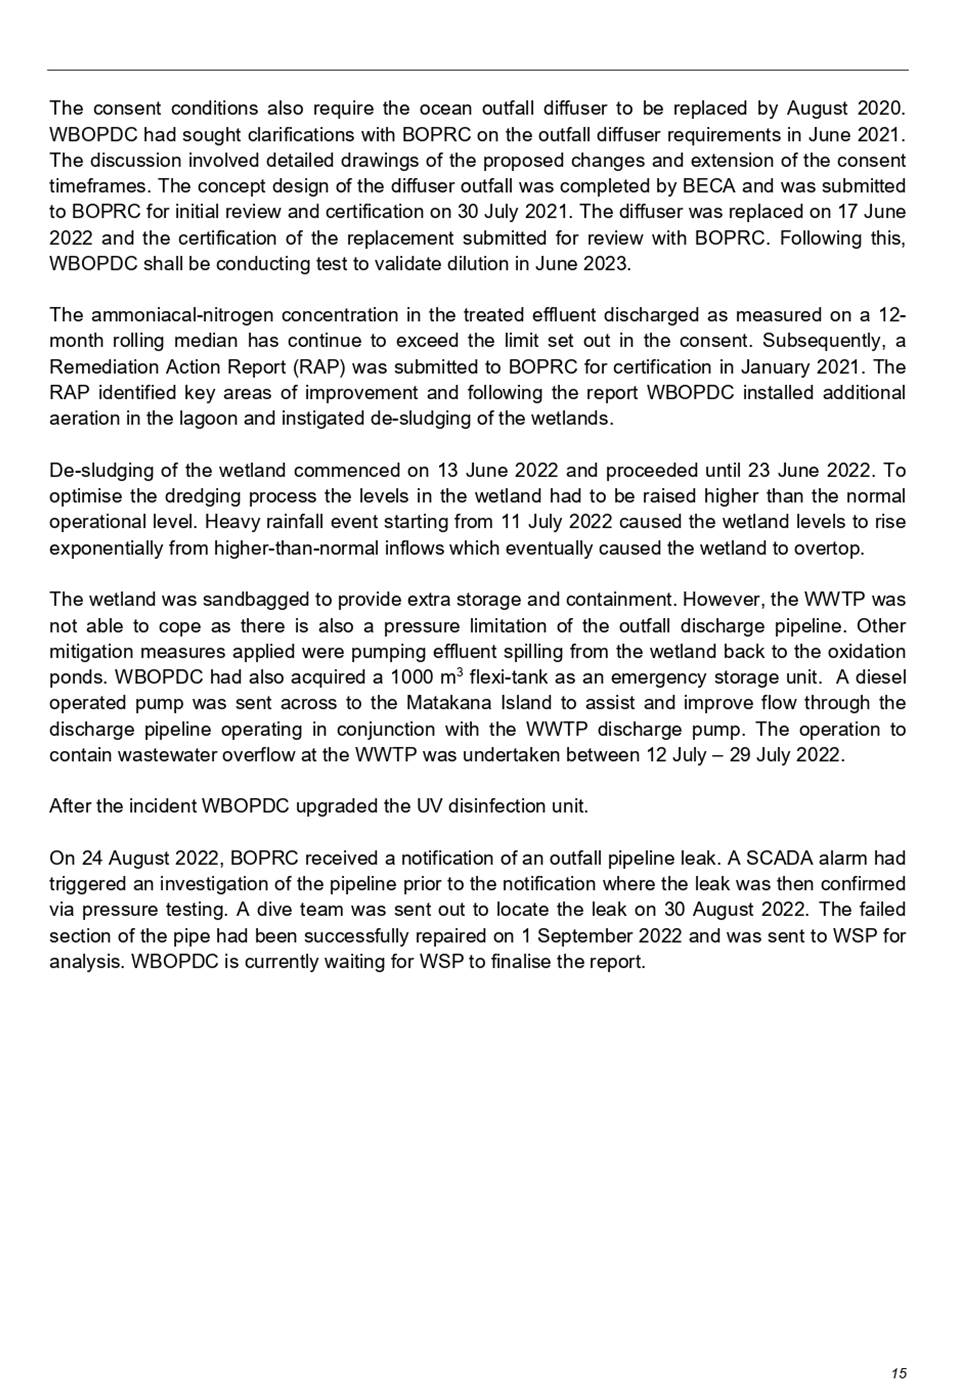
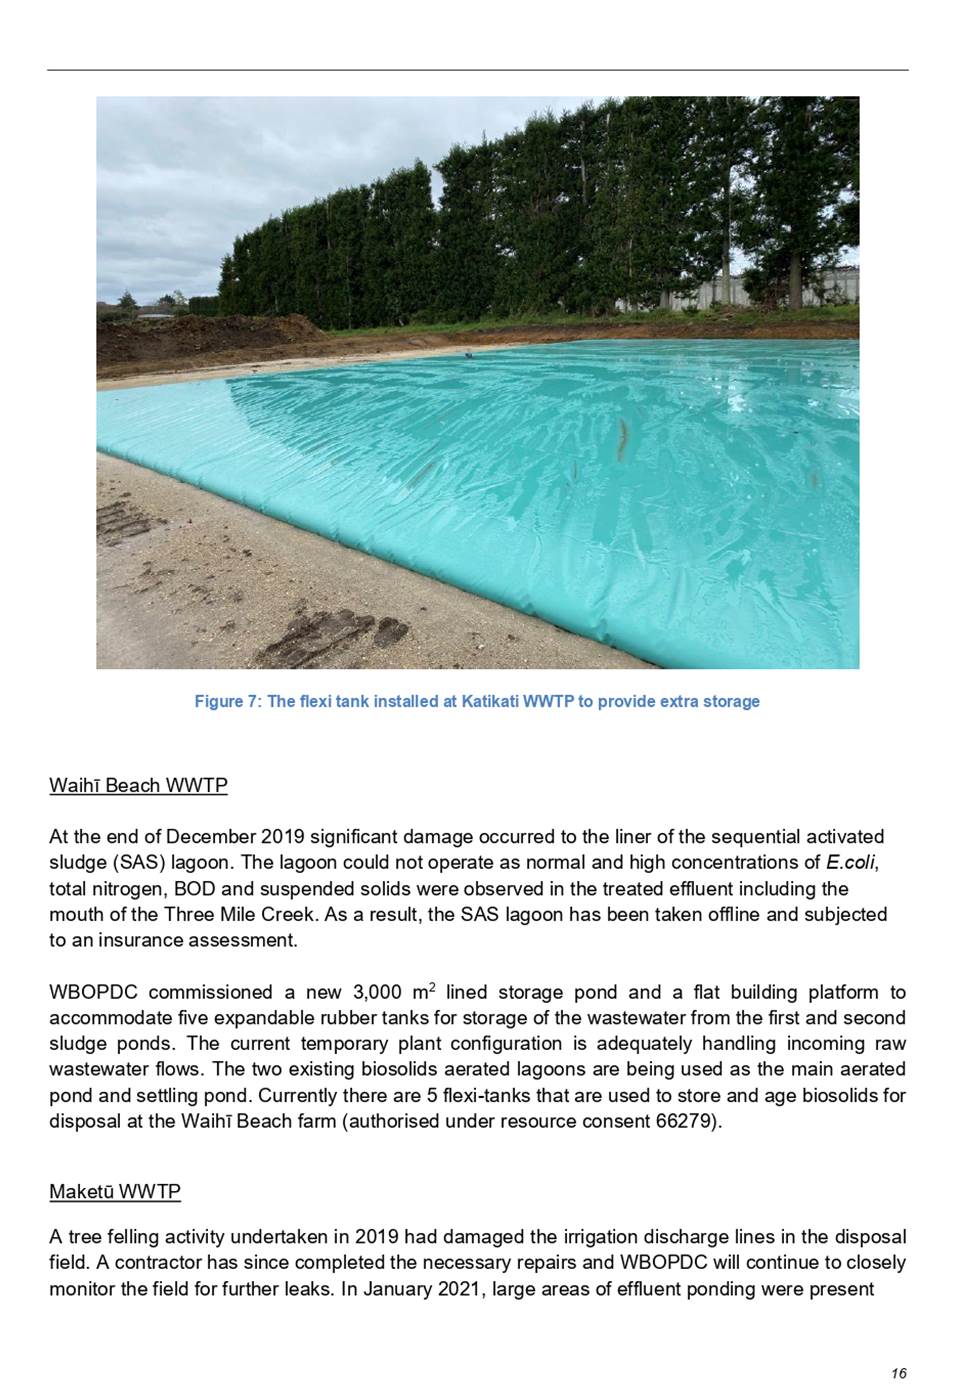
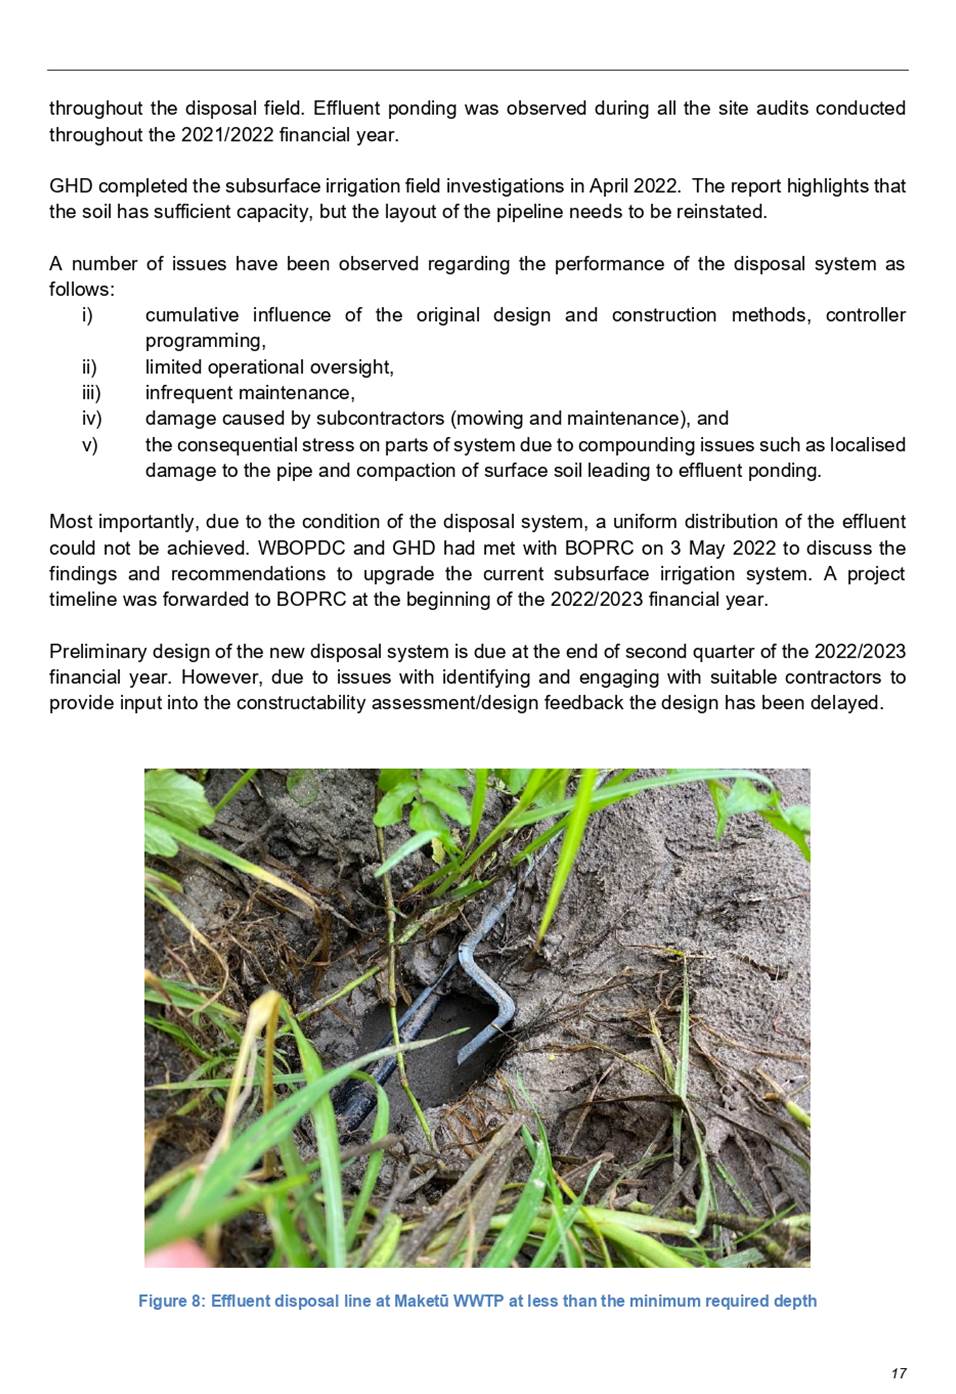
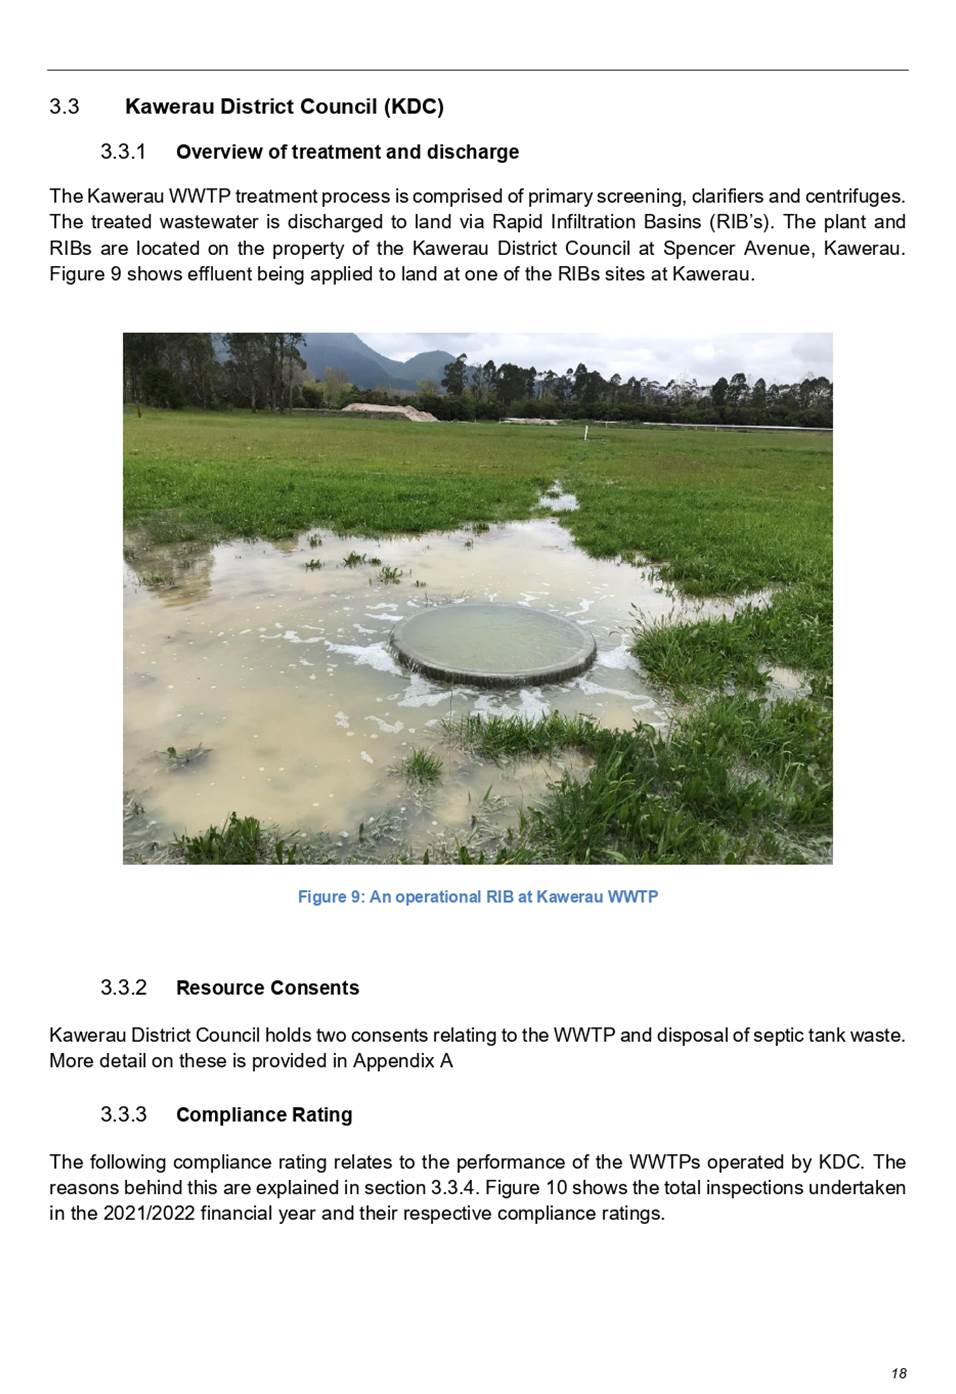
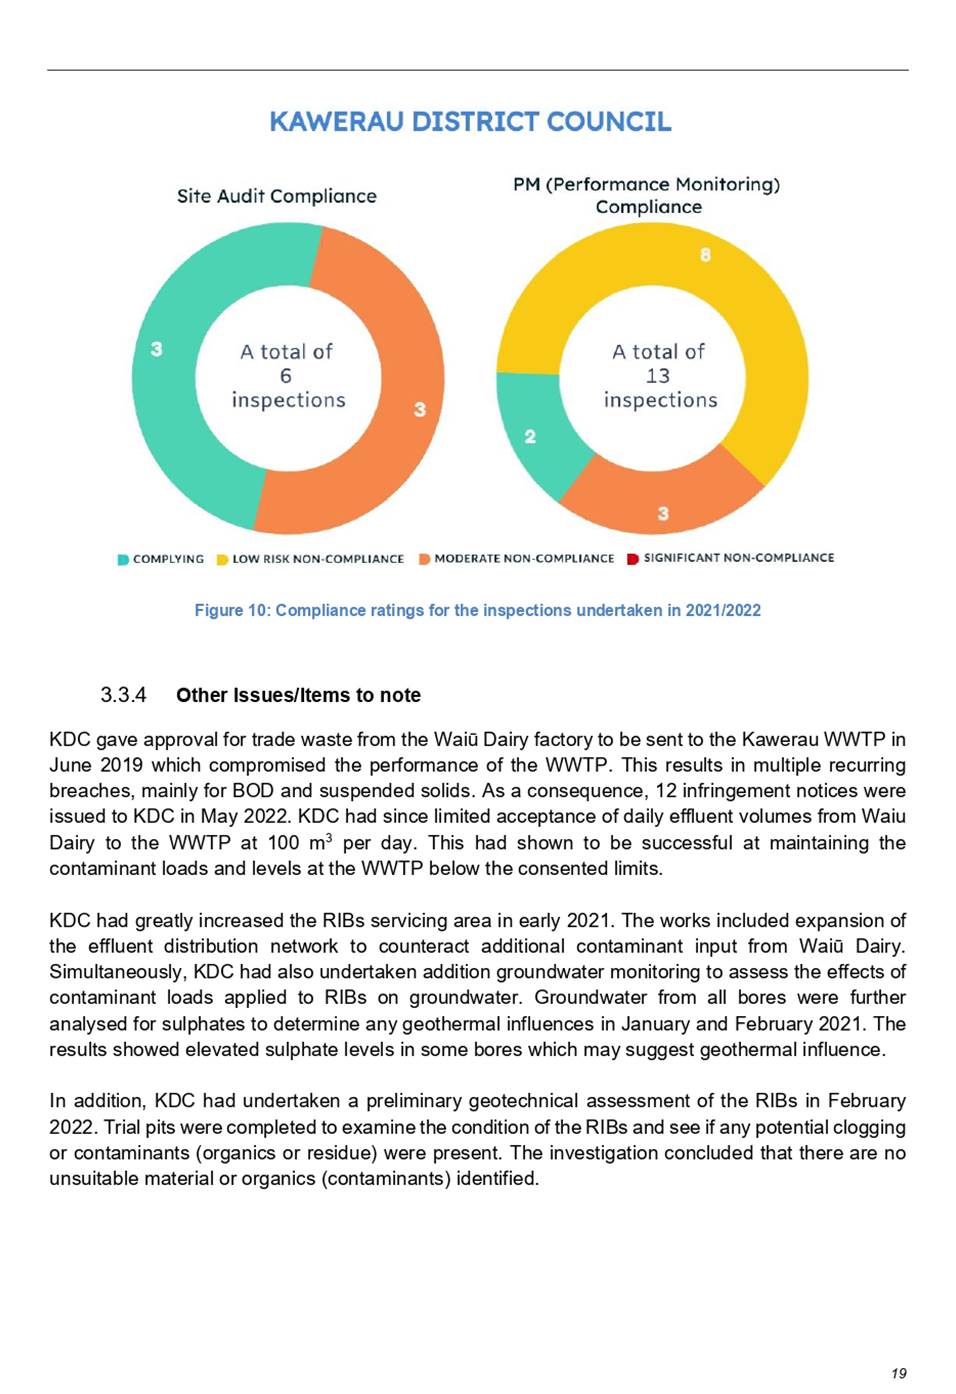
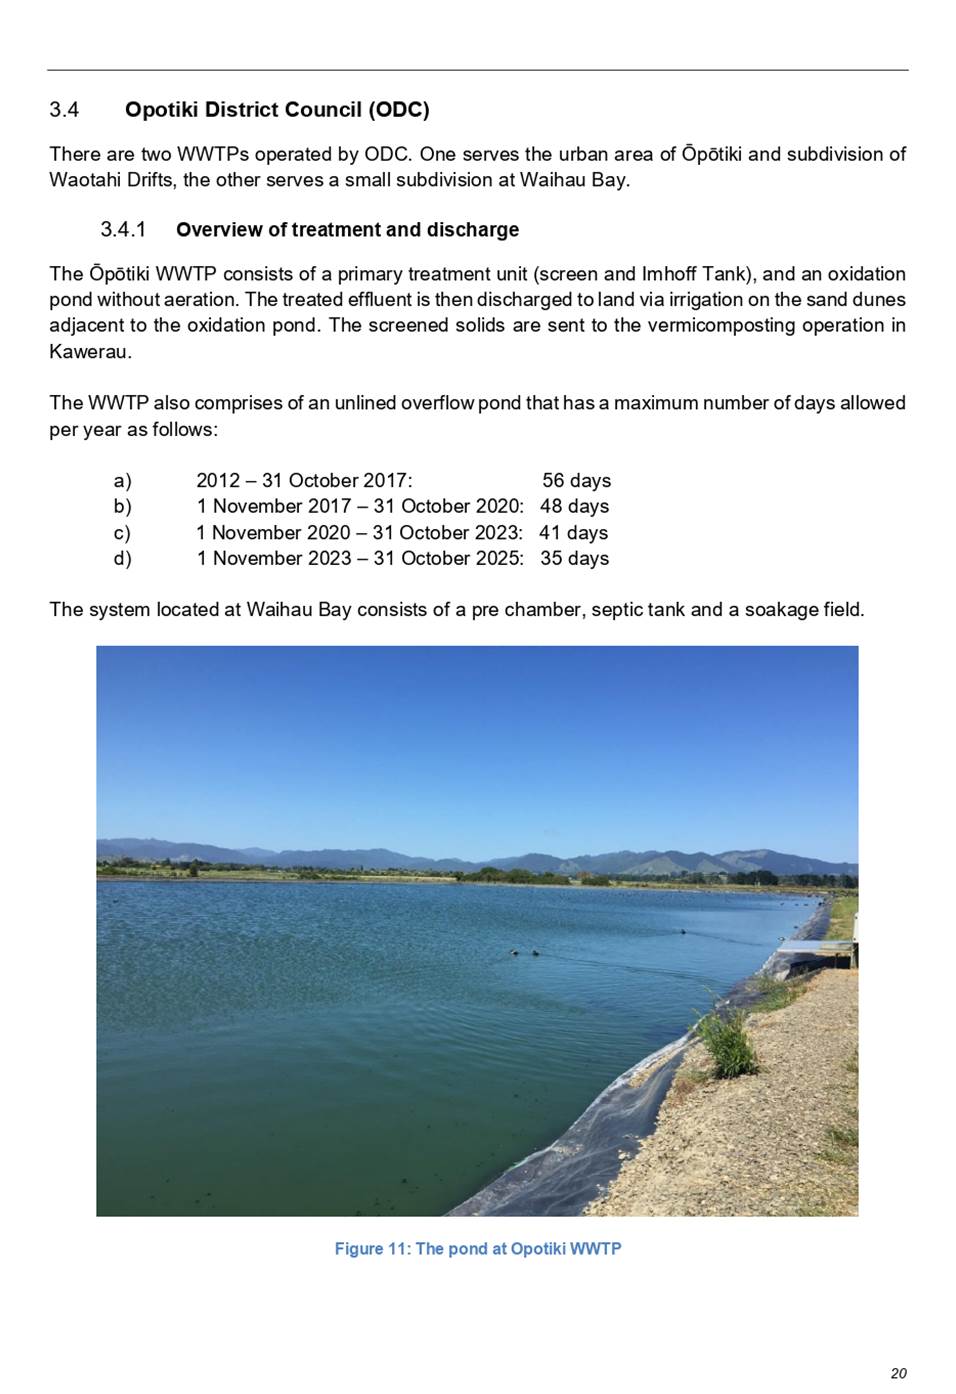
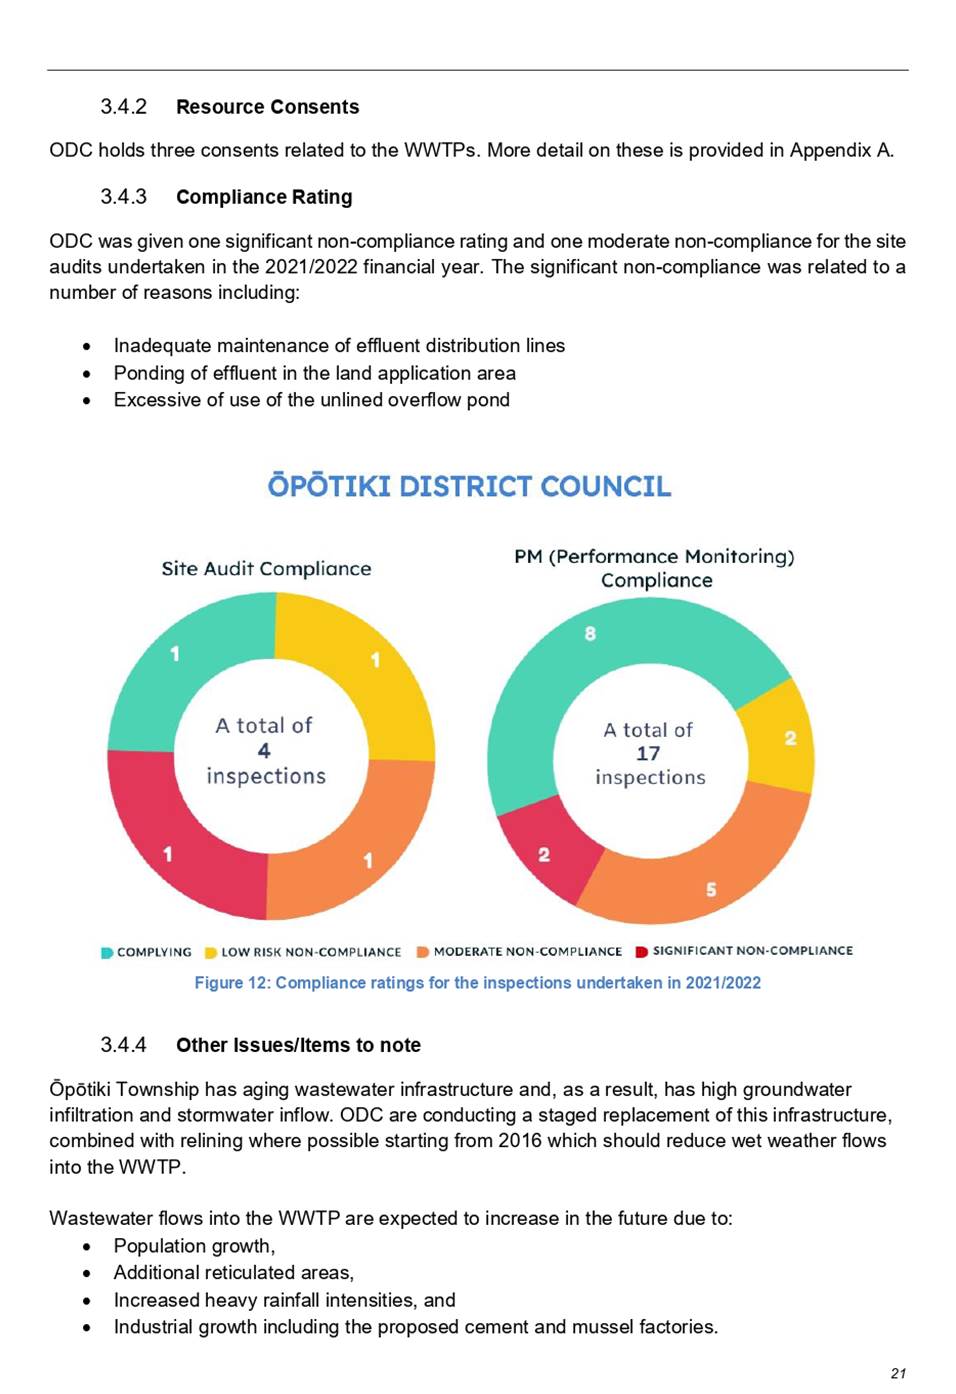
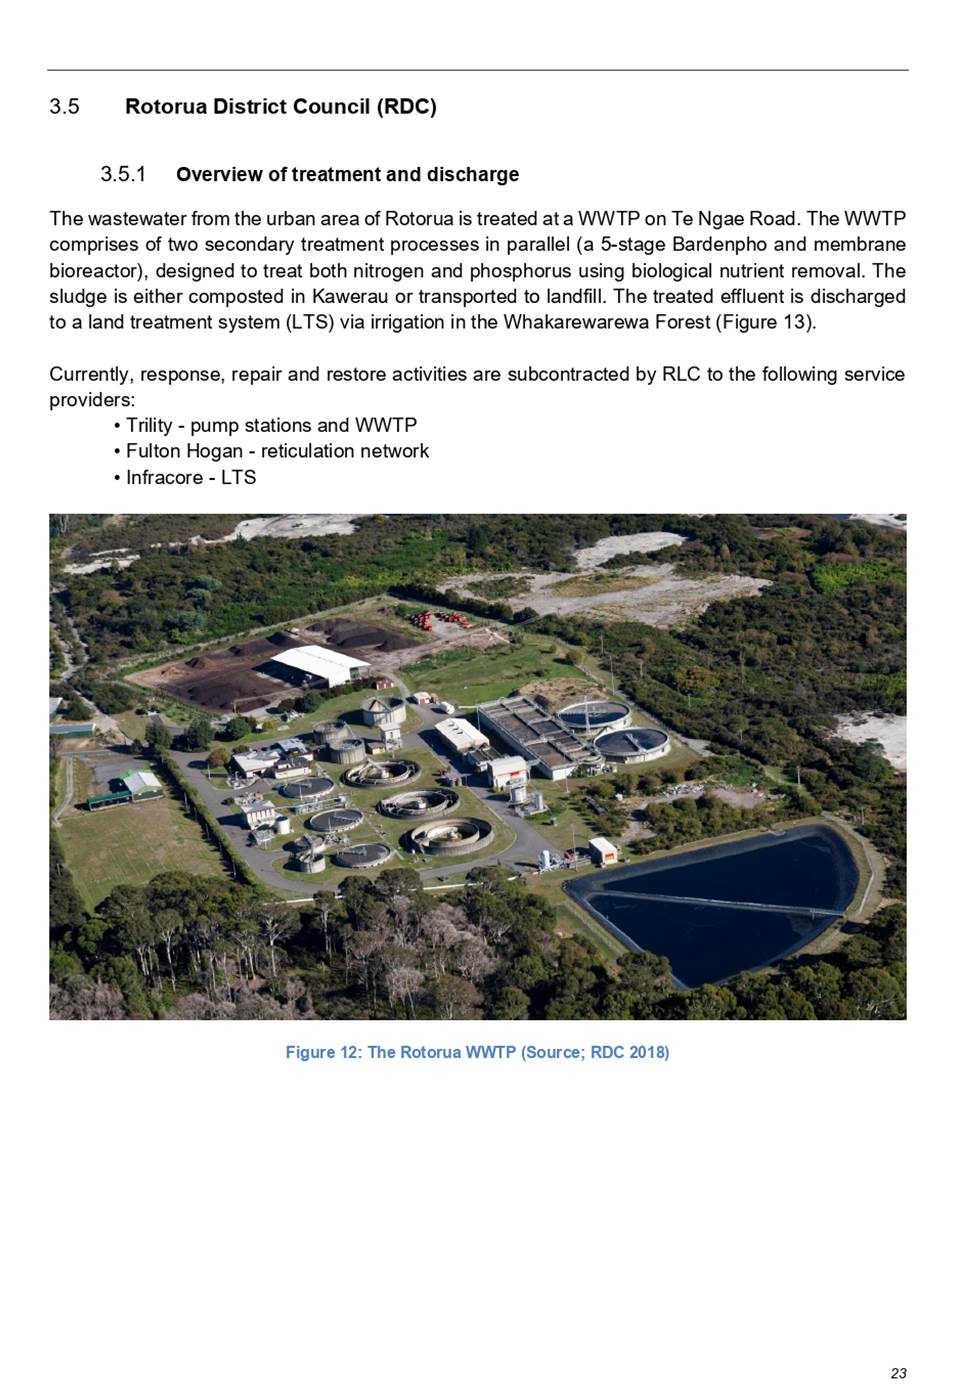
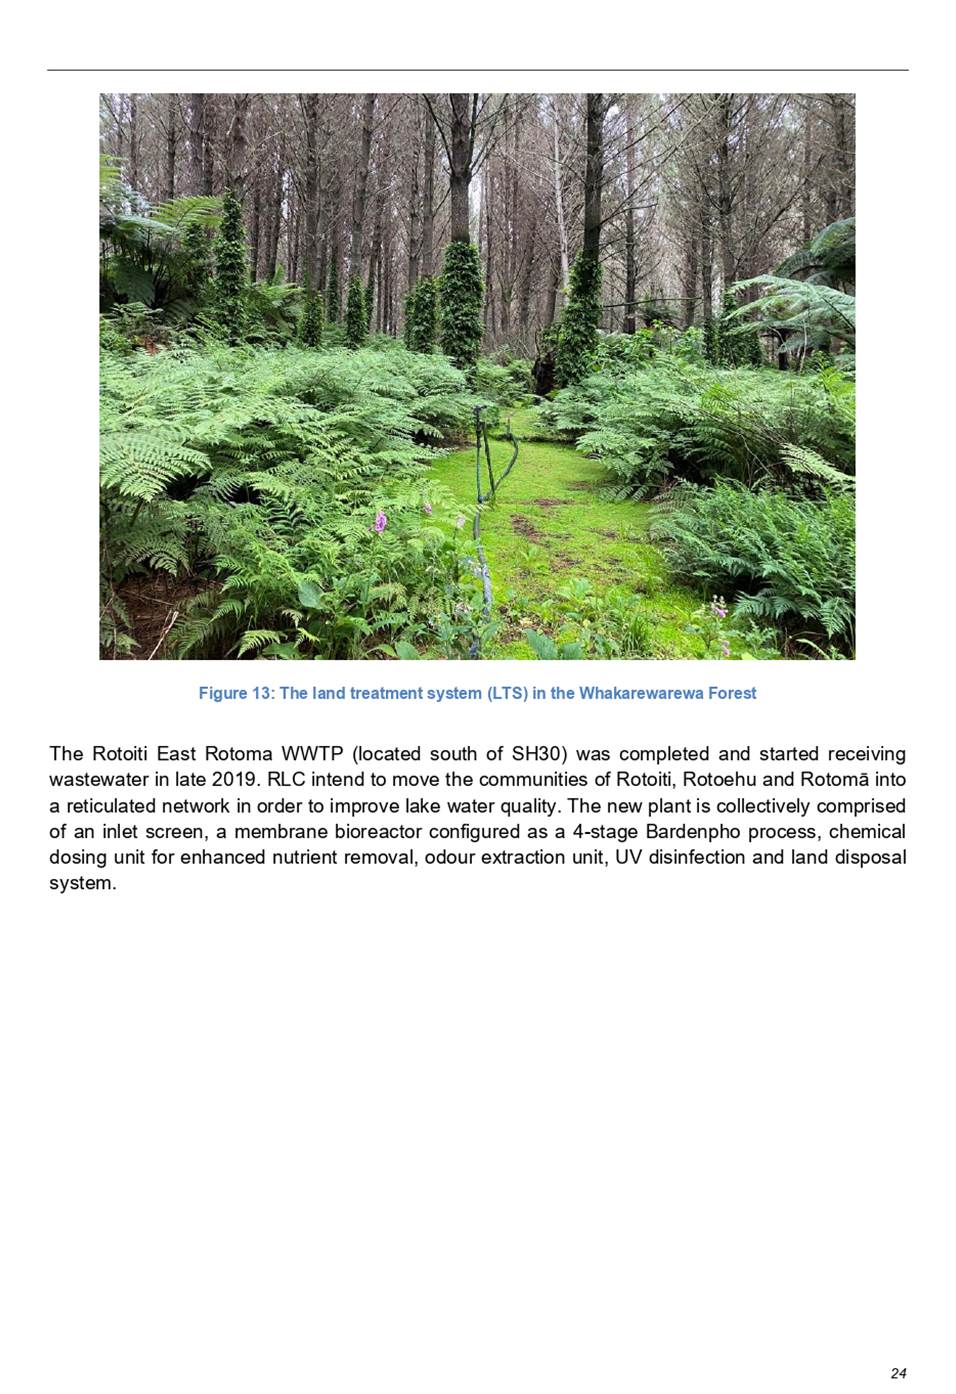
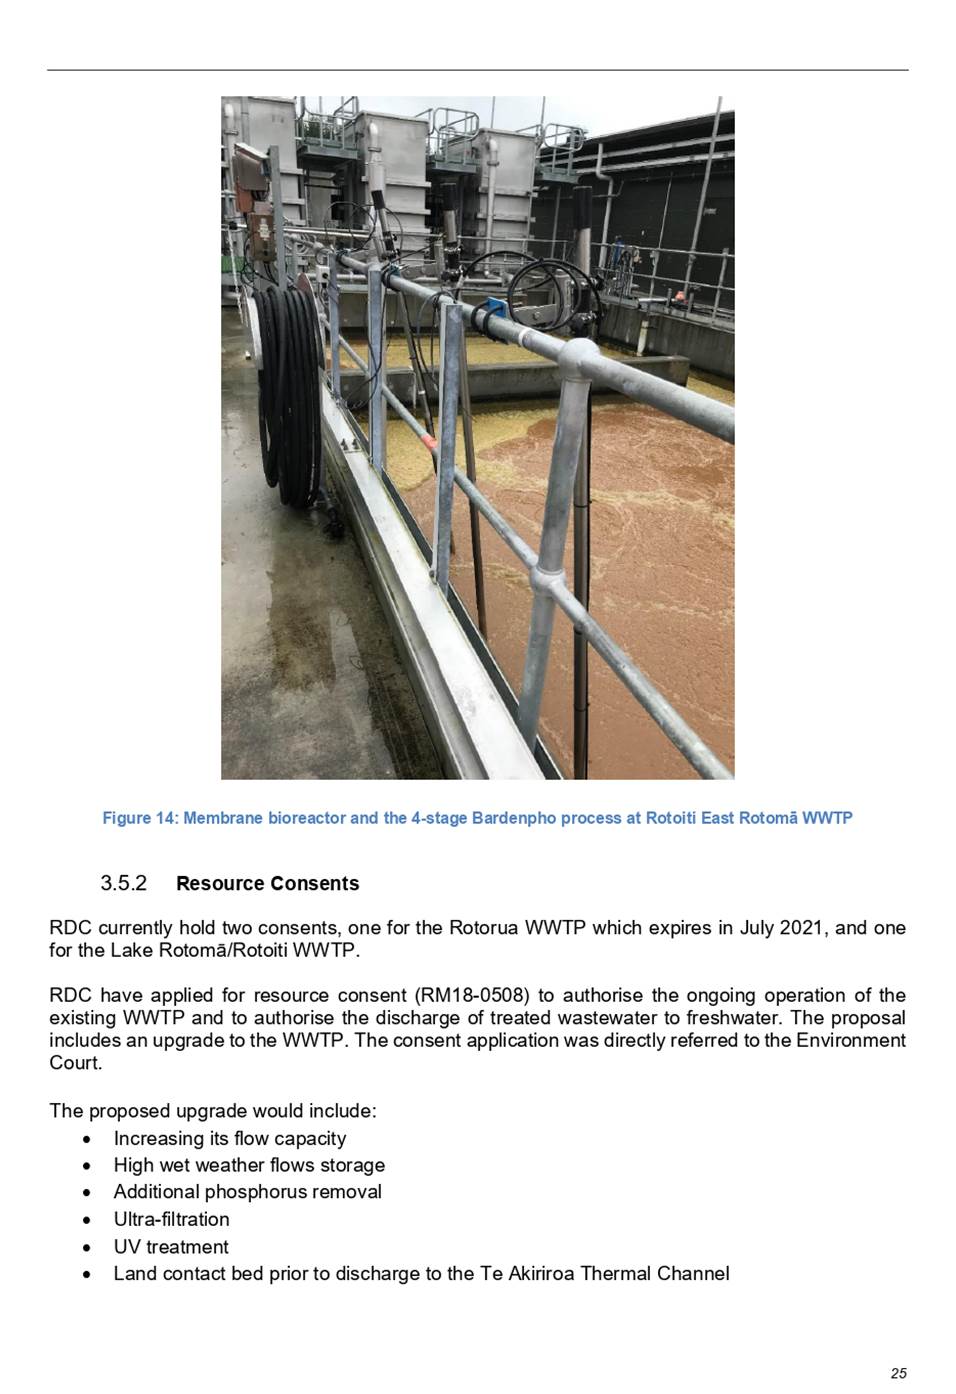
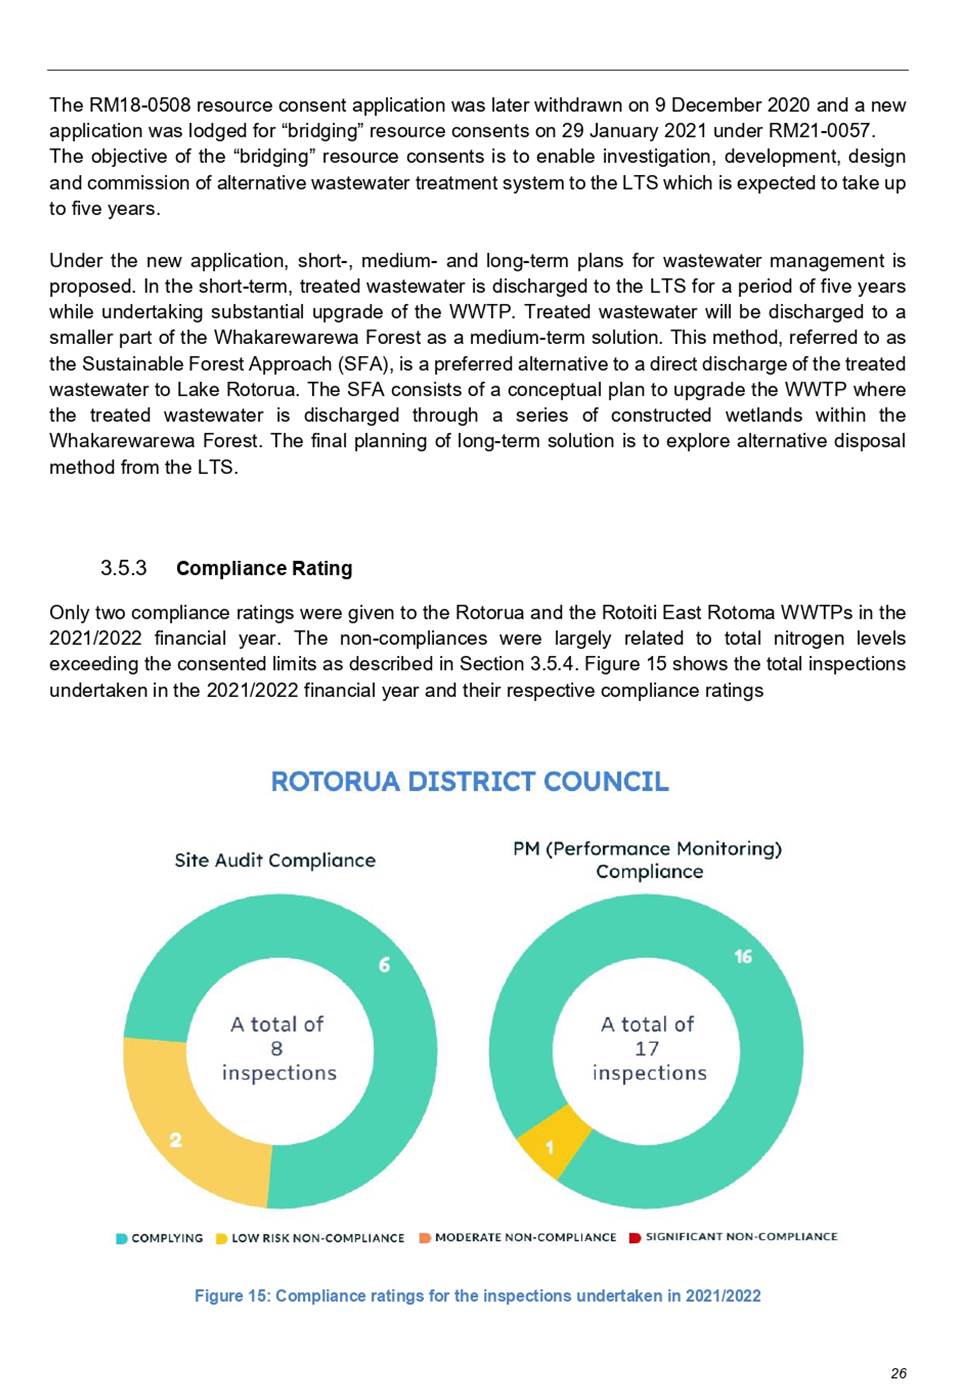
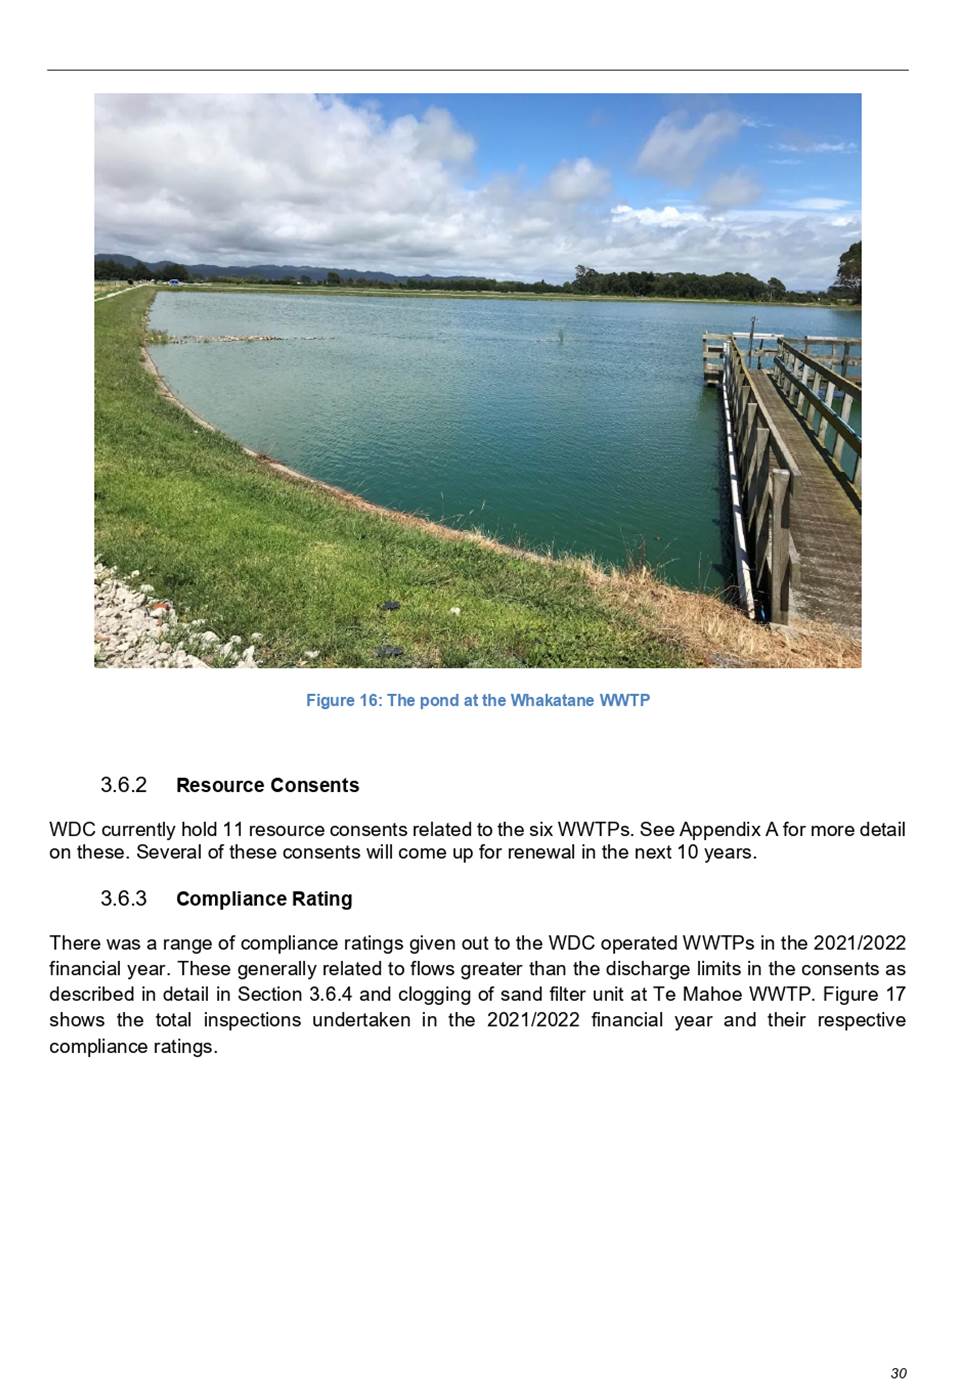
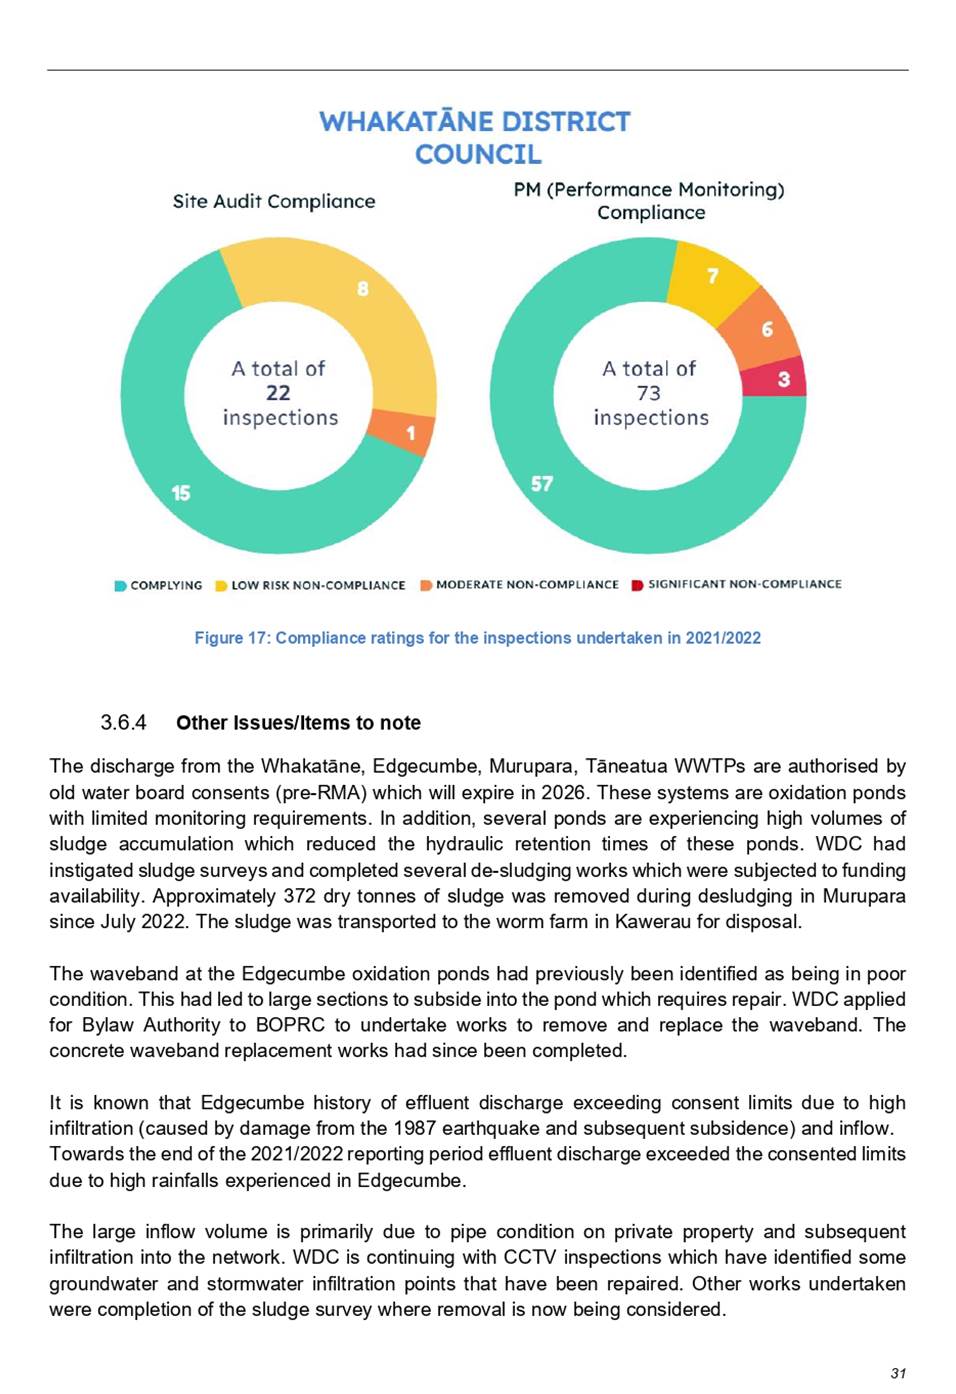
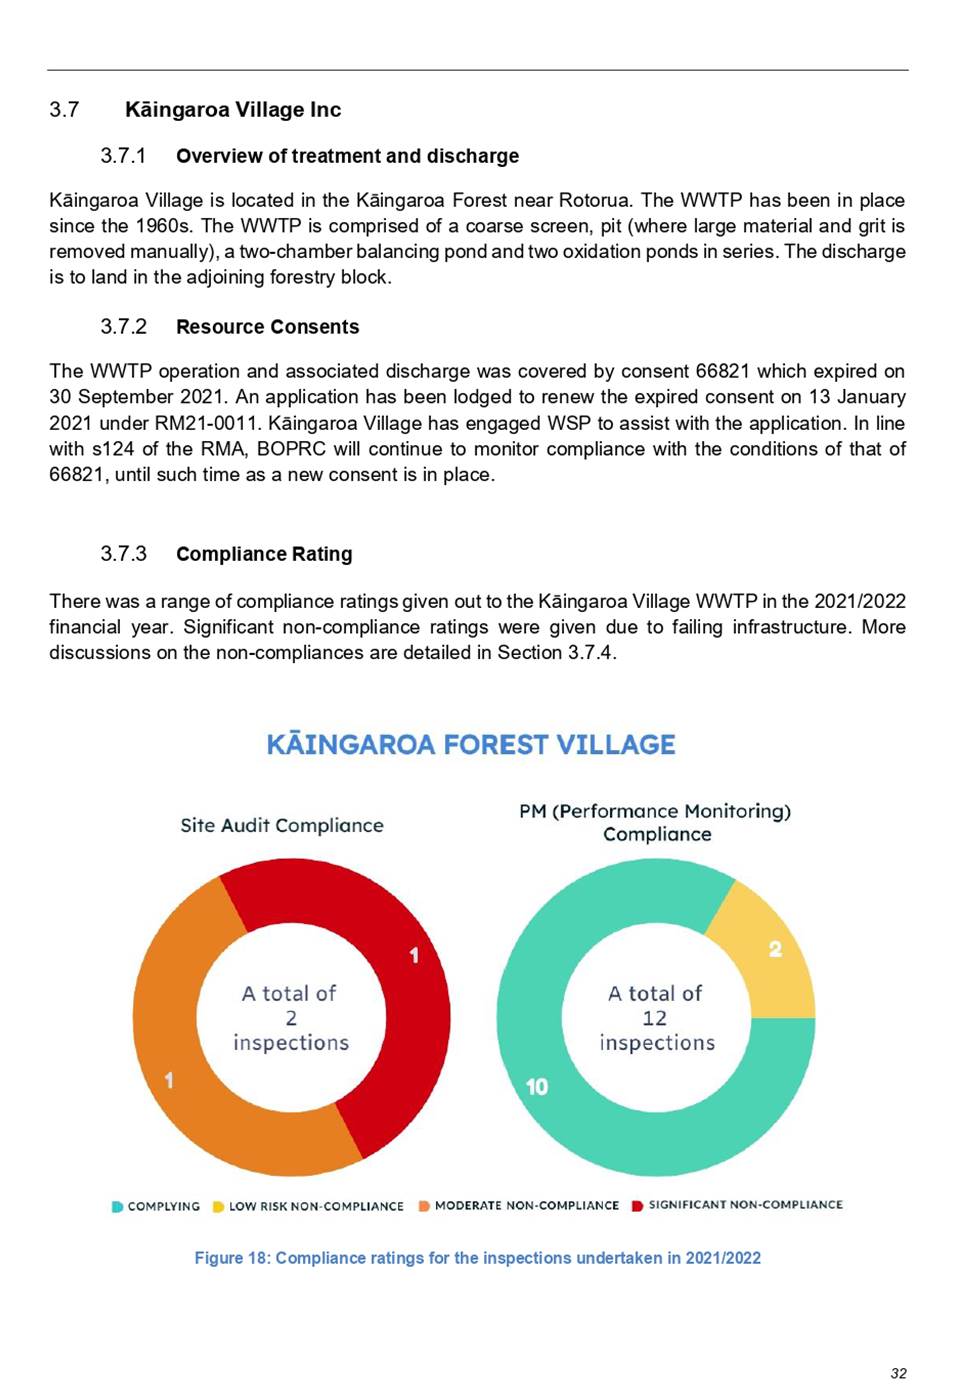
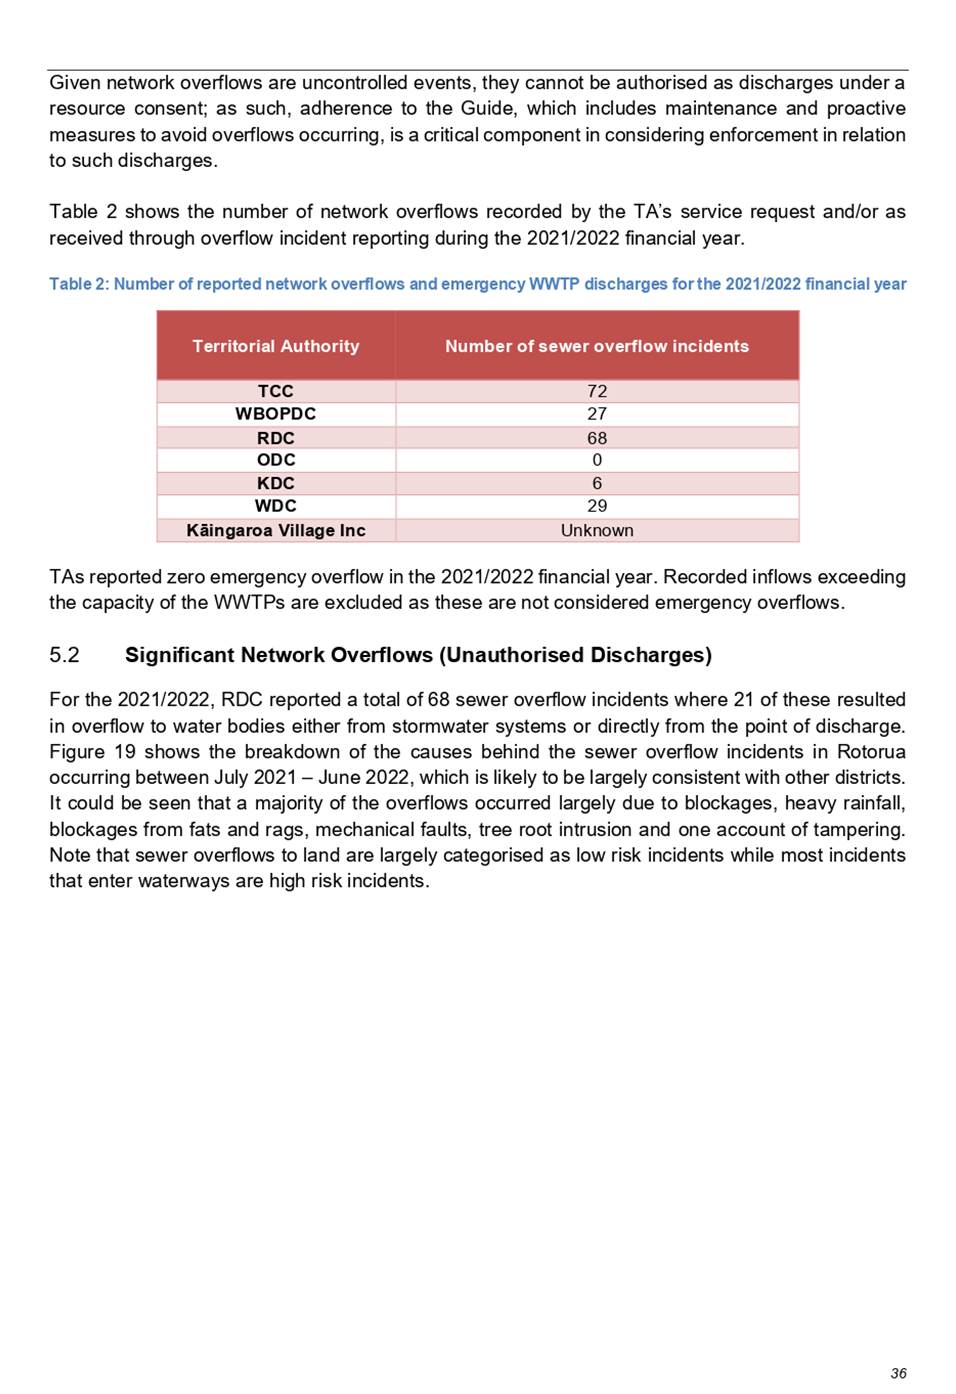
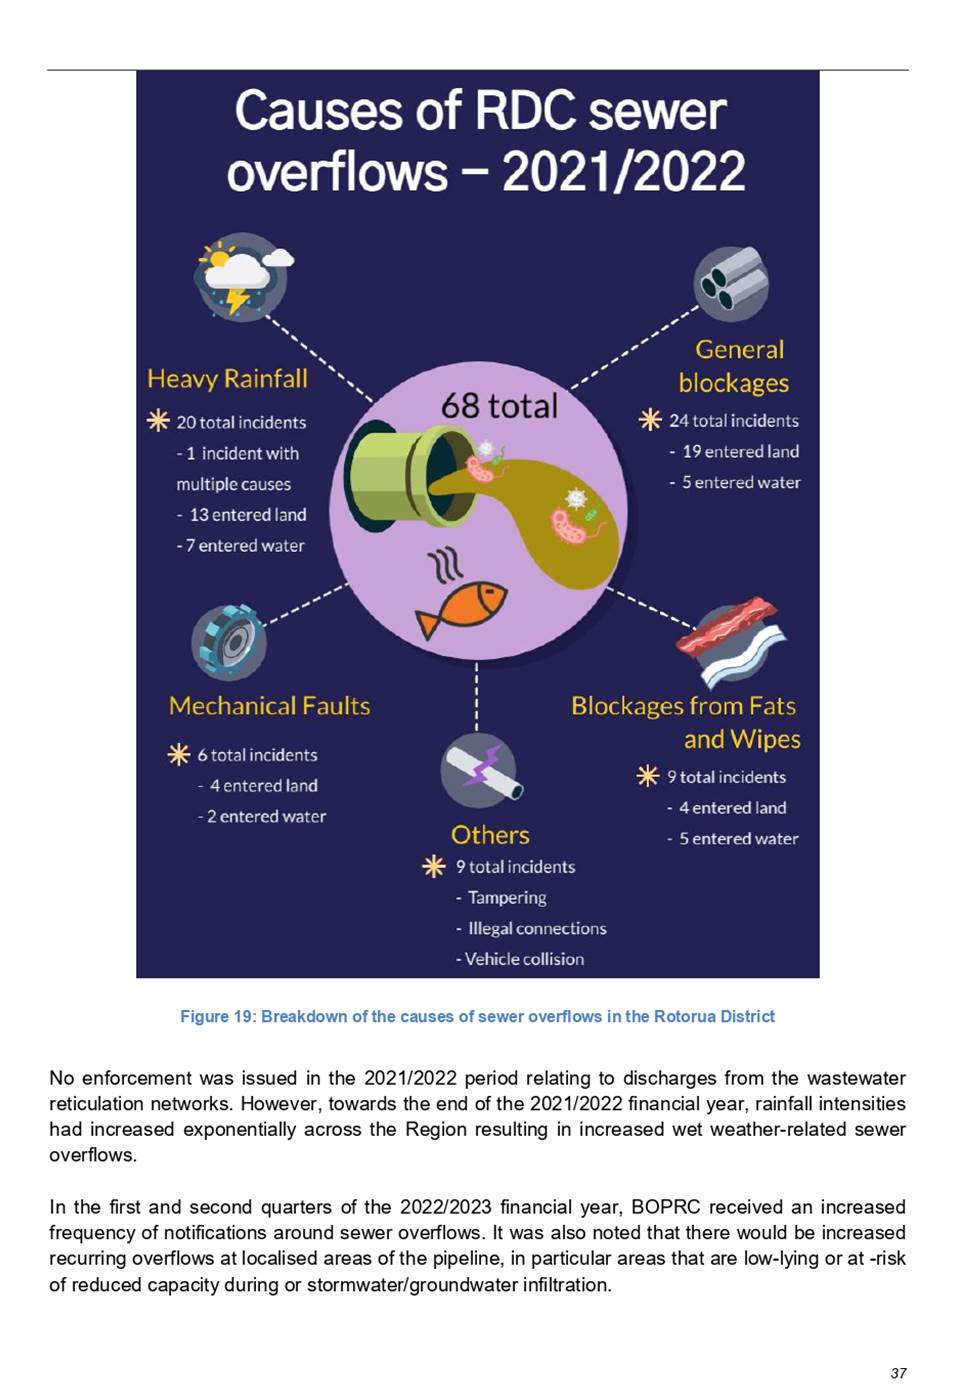
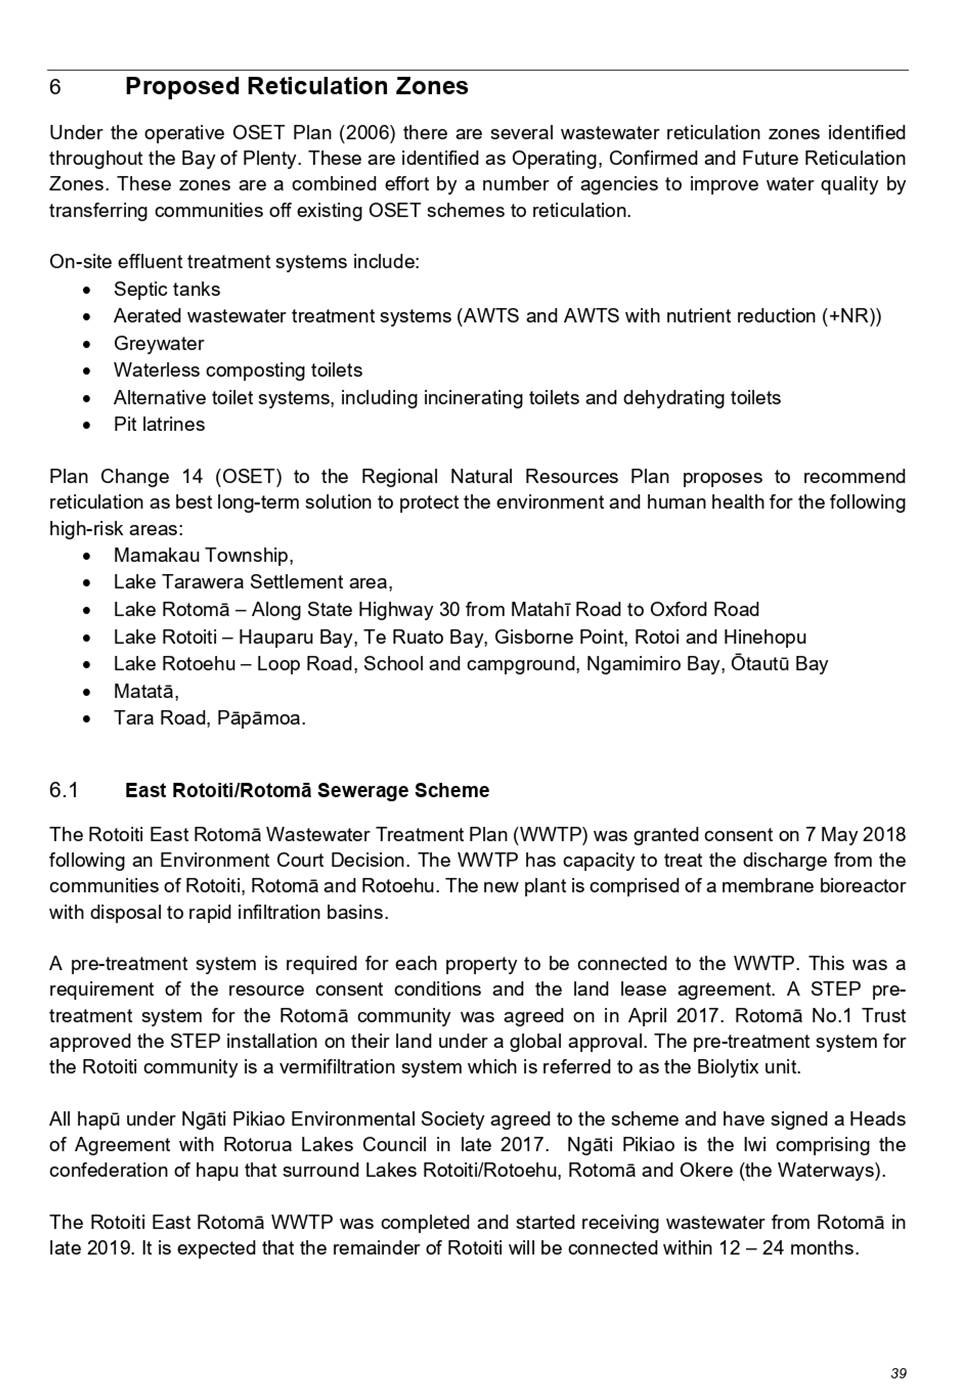
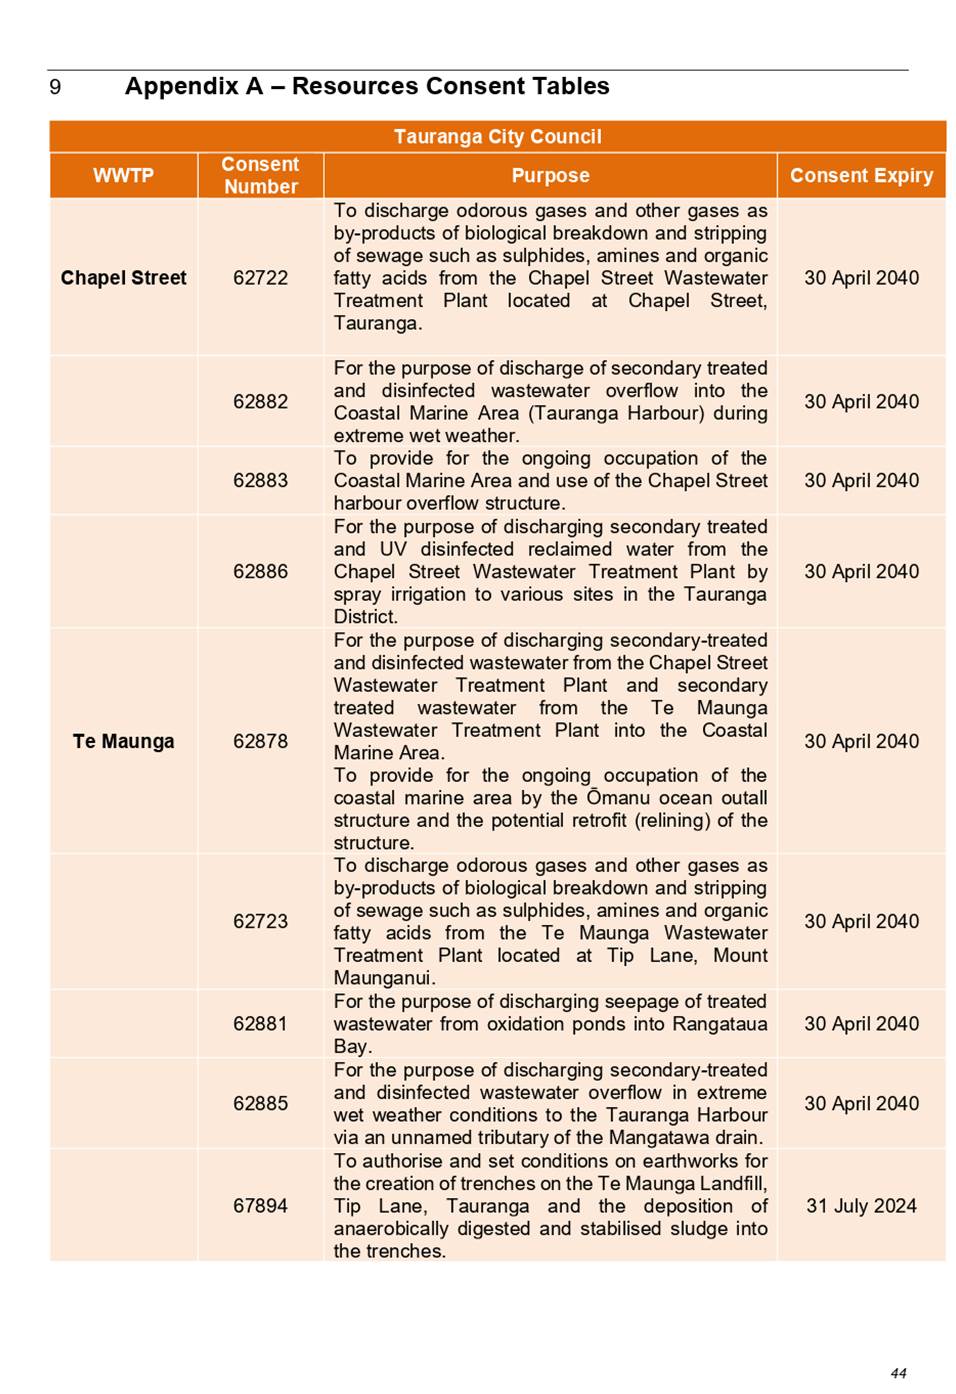
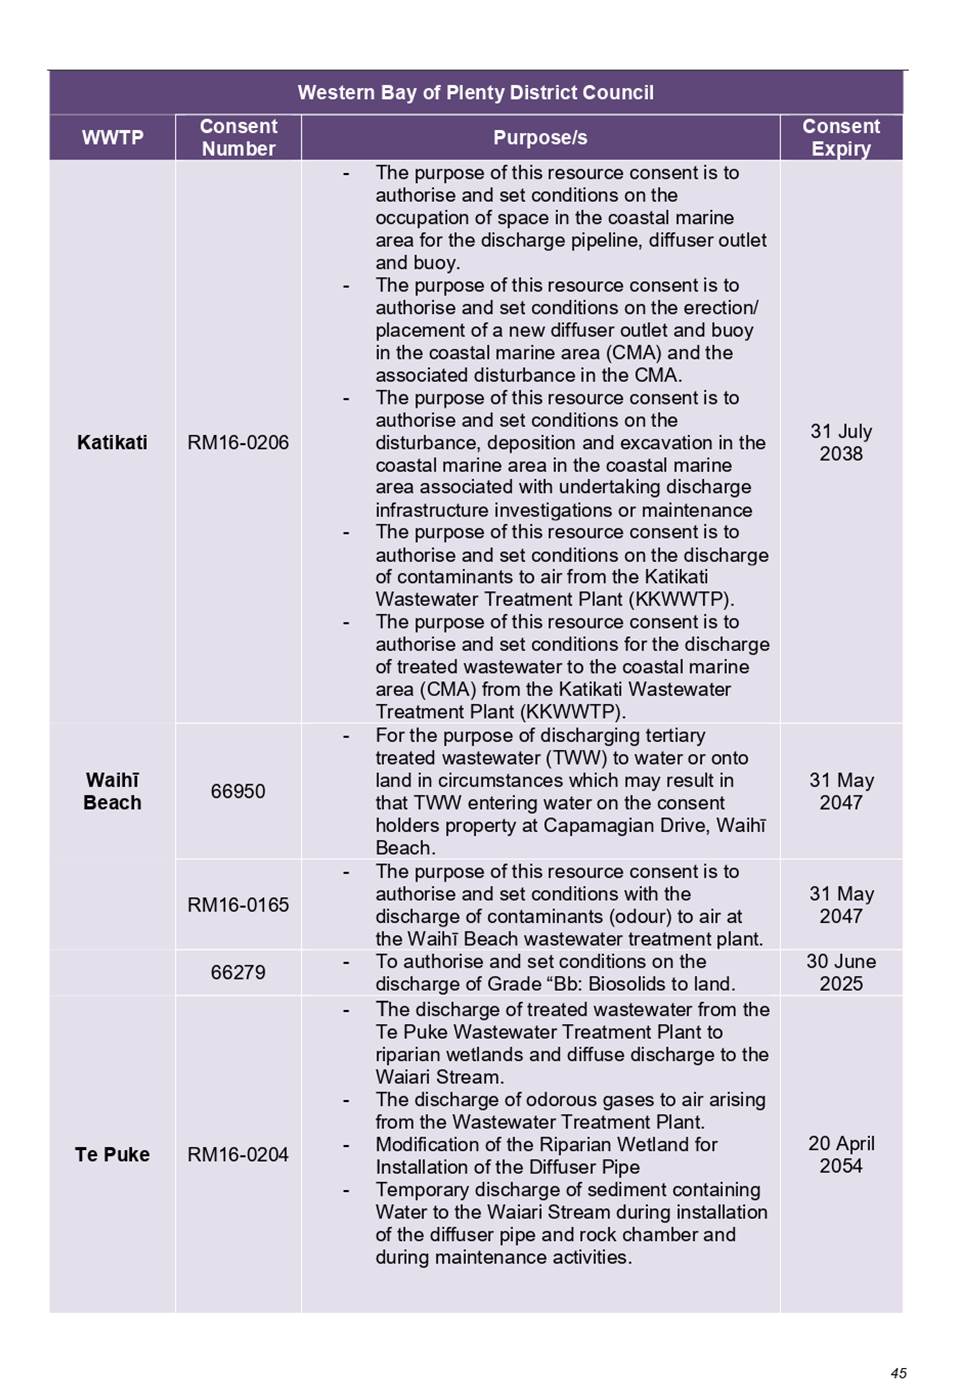
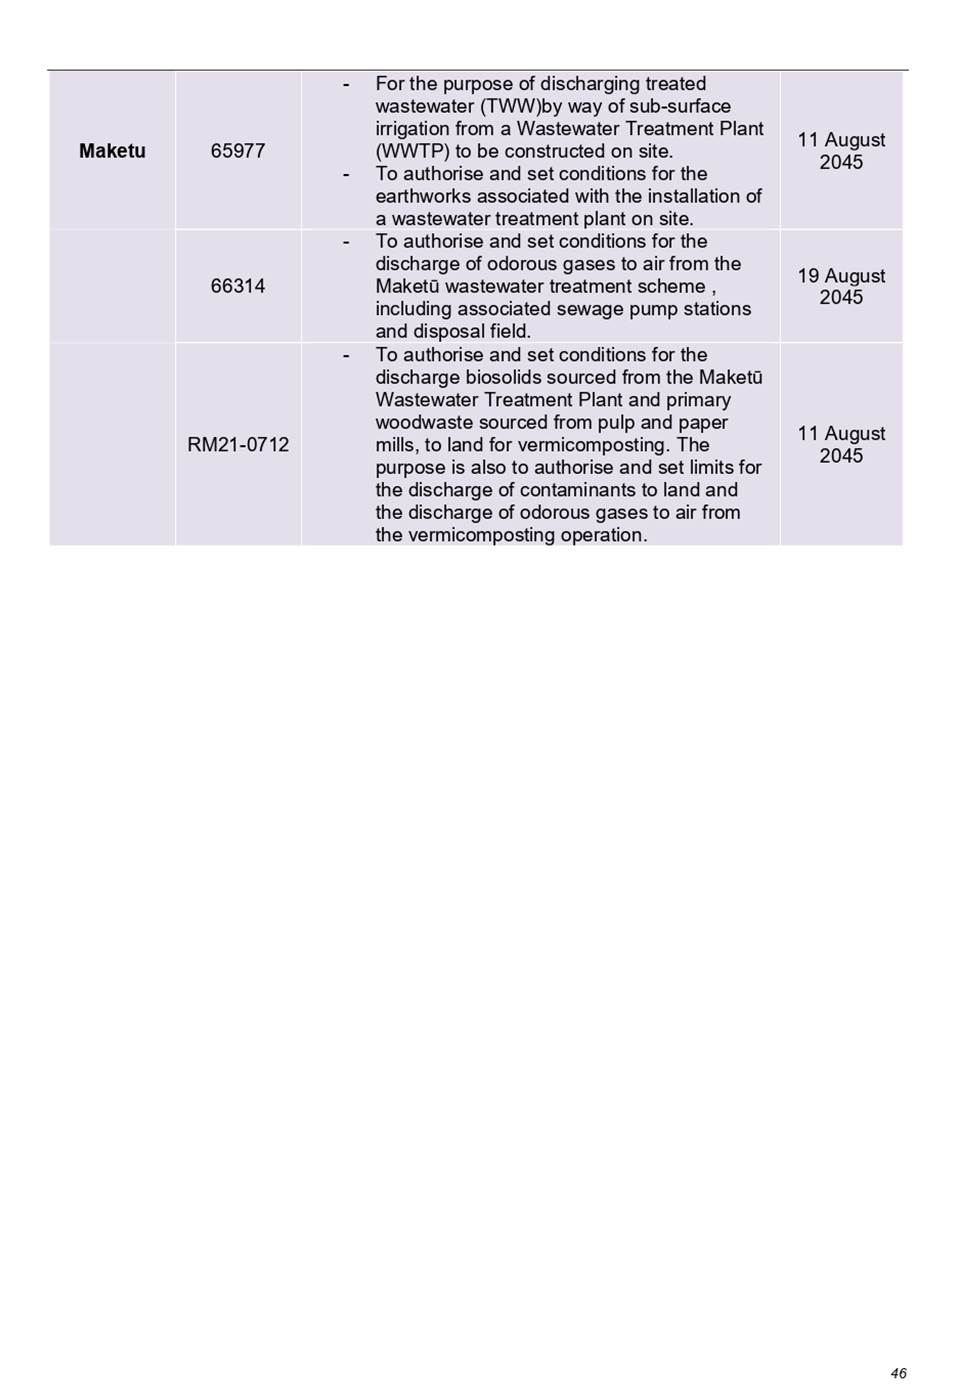
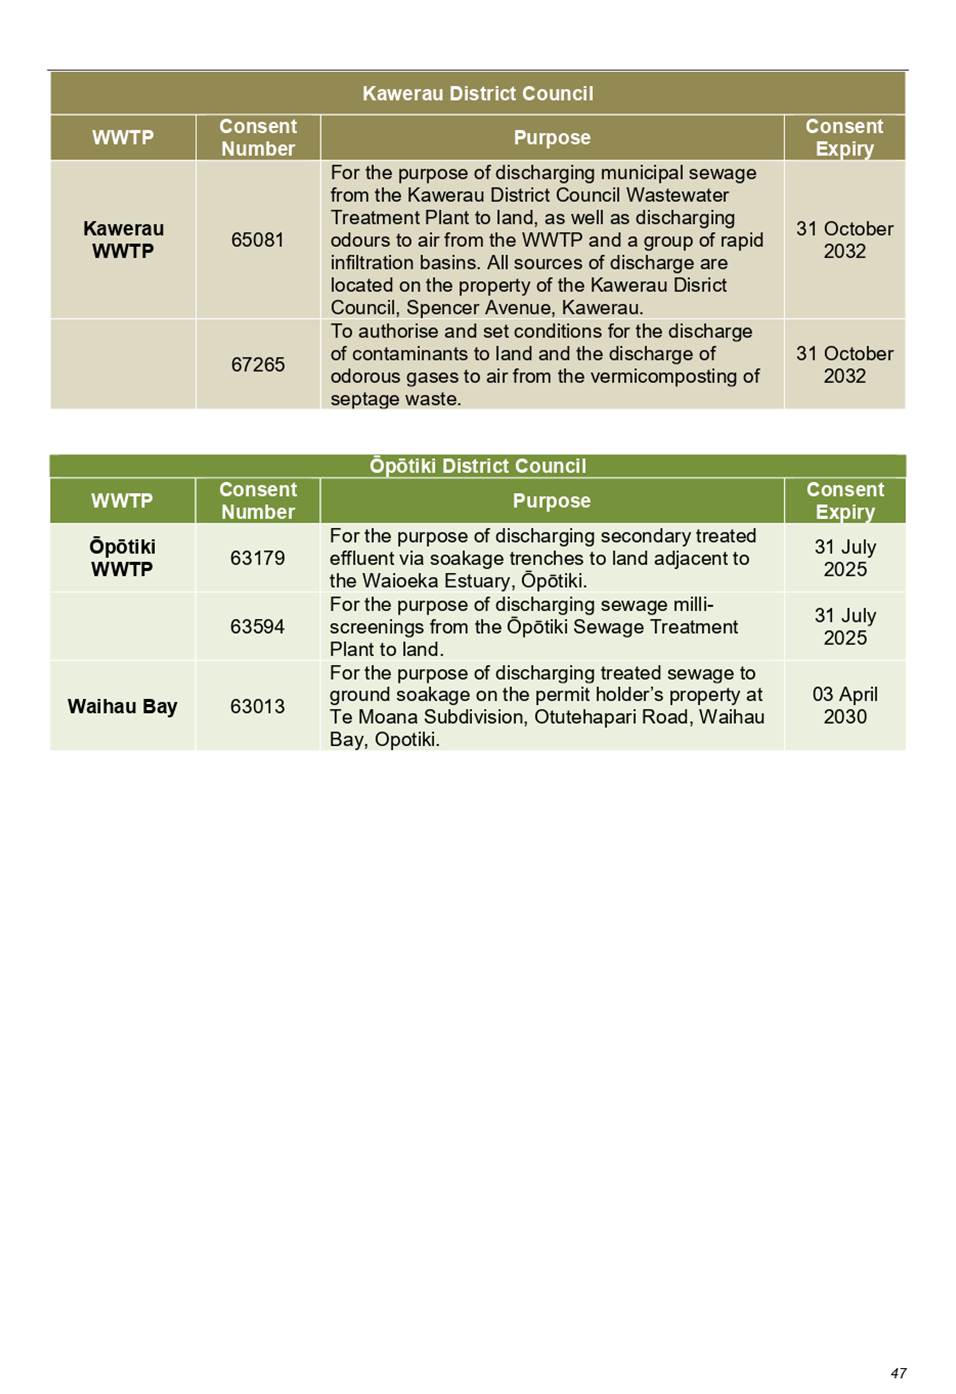
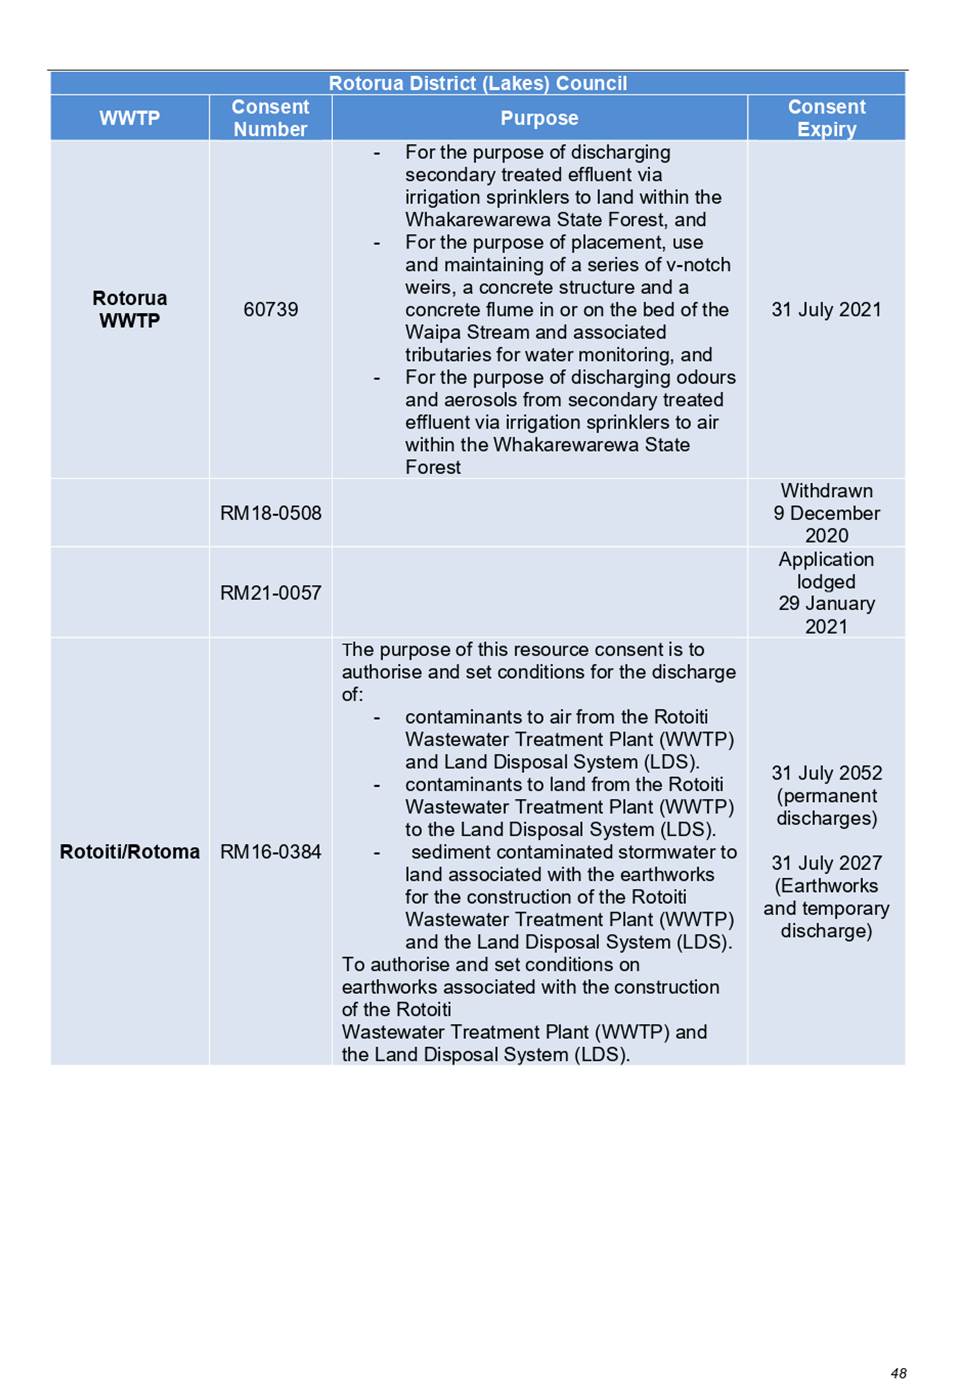
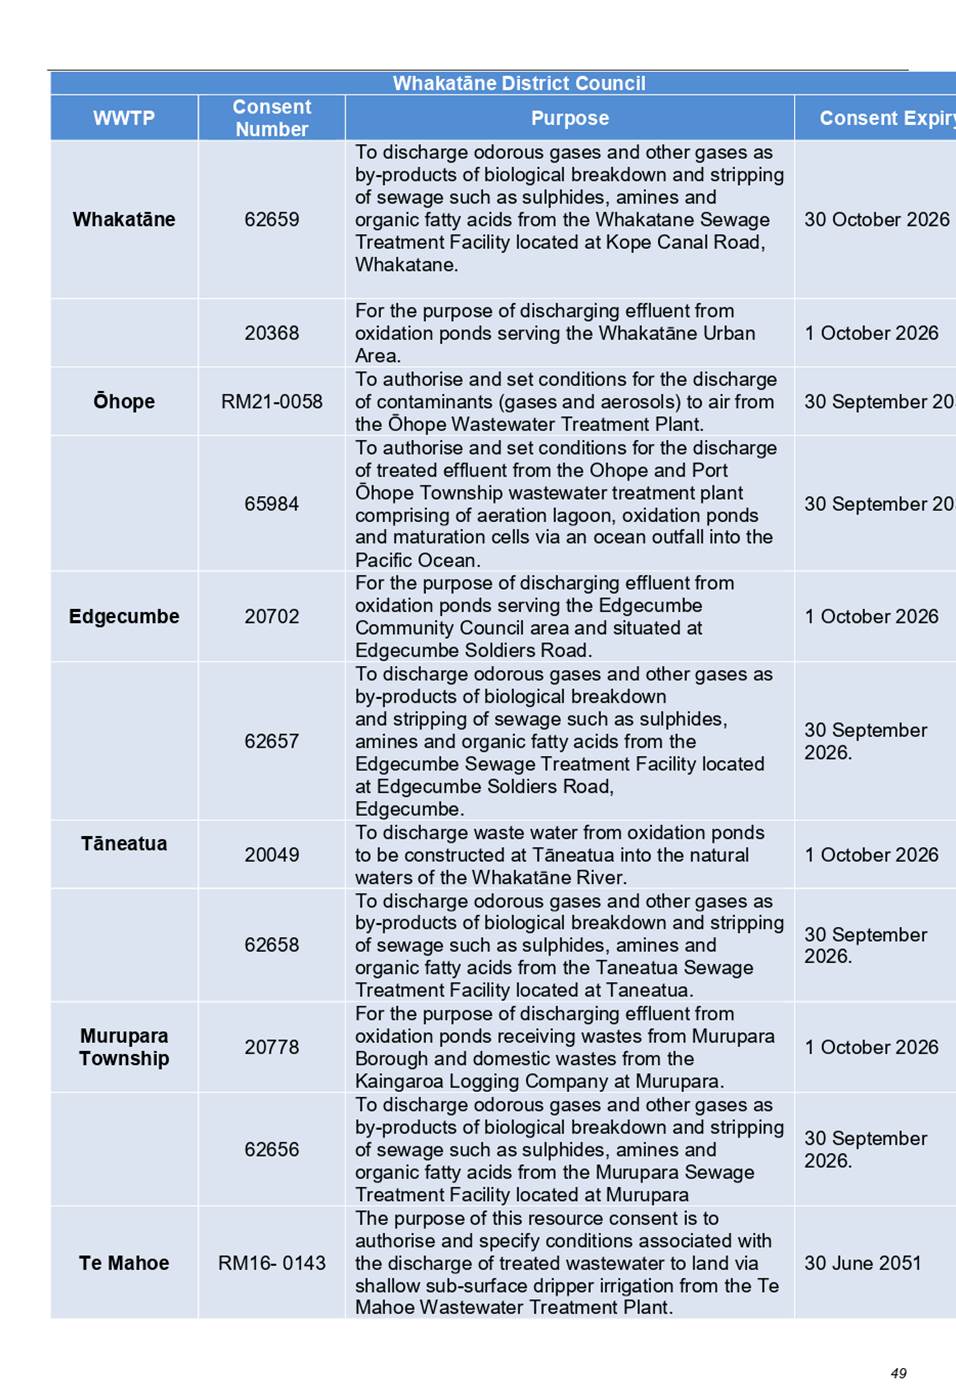
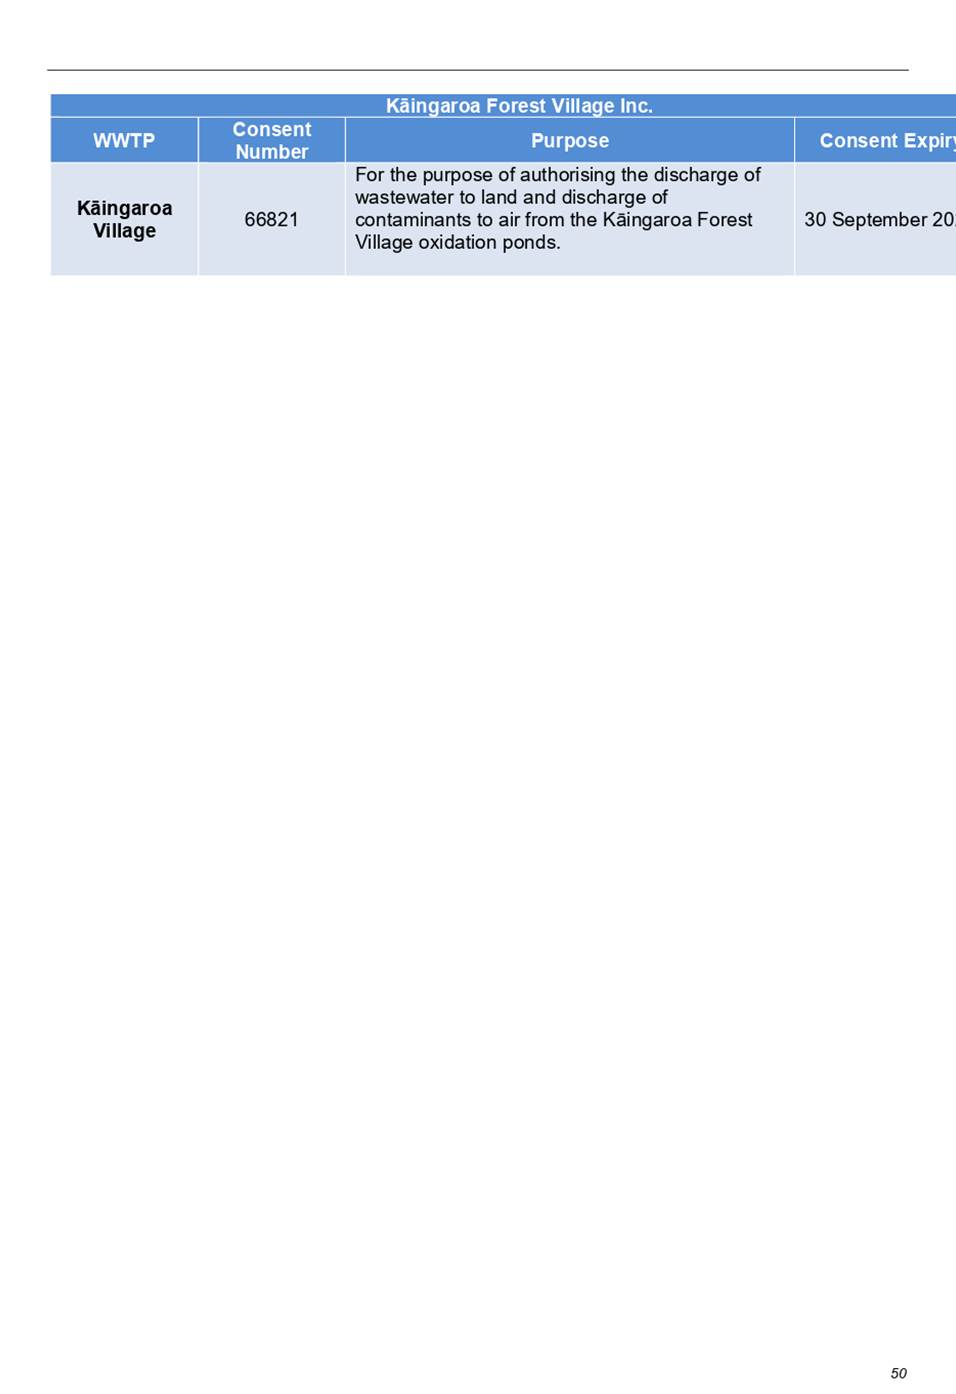
|
|

|
|
|
|
Report To:
|
Monitoring
and Operations Committee
|
|
Meeting
Date:
|
7 March
2023
|
|
Report
Writer:
|
Reece Irving, Senior Regulatory
Project Officer
|
|
Report
Authoriser:
|
Reuben Fraser,
General Manager, Regulatory Services
|
|
Purpose:
|
An update to the Committee on
activities being undertaken to improve air quality and the overall
environment in the Mount Maunganui airshed.
|
|
|
|
Mount
Maunganui Industrial Area update
|
Executive Summary
This
report provides an overview of the Mount Maunganui Airshed and the activities
being undertaken to improve air quality and the wider environment in the
Mount Maunganui industrial area. The report covers the period from September
2022 until February 2023.
During
this period, two breaches of the PM10 National
Environmental Standards for Air Quality (NES) were recorded within the
airshed. In December 2022 a breach at the Rata Street monitoring site was
attributed to events causing dust plumes on a nearby industrial site whilst a
February breach at Aerodrome Road continues to be investigated. Only one
exceedance in a 12-month period is allowed under the NES.
The
report gives a summary of actions undertaken by various teams across council,
including compliance, consents, complaint response, data services, policy and
planning and the Port of Tauranga.
|
Recommendations
That the Monitoring and Operations Committee:
1 Receives the report, Mount Maunganui Industrial Area update.
1. Introduction
This
update includes some background on establishing the Mount Maunganui Airshed as
well as continued reporting on activities and actions undertaken to mitigate
the impacts of industrial discharges to air and the wider environment in the
Mount Maunganui industrial area.
Air
quality in the area has been degrading over time as industrial activities and
vehicle movements have increased significantly in recent years.
Bay of
Plenty Regional Council has an extensive work programme underway to improve air
quality in this area. Measured breaches of National Environmental Standards
(NES) for PM10
and sulphur dioxide (SO2) have been reducing year
on year, however the community remain concerned that airshed pollution is
impacting human health. The objectives of the programme are:
Short
term: meet our legislative
requirements for air, land, and water quality
Long
term: deliver on the
community’s expectation to live in a healthy environment
The
Mount Air Quality Working Party remains active in bringing together various
central and local government agencies, iwi / hapū, community groups,
councillors, commissioners, and industry representatives. This group is working
towards better outcomes for all stakeholders in the Mount Maunganui airshed and
surrounding residential areas with a number of actions planned for 2023.
1.1 Background
In 2018 as a response to a rise
in industrial and port activity, transport movements, and an increase in
pollution hotline calls raising community concerns around degraded air and
general environmental quality, the Regional Council made the decision to
increase investment in air quality monitoring in the Mount Maunganui industrial
area with an additional investment of $500,000 per annum in the monitoring
network.
Watercare Services were engaged
to provide independent air quality monitoring infrastructure and technical
support and the monitoring network was expanded from two existing locations
(Totara Street, operating since the mid 1990’s and Whareroa Marae,
monitor installed in 2015), to a total of 11 monitoring sites within the Mount
Maunganui industrial area. Each monitor was calibrated to detect a variety of
air-borne pollutants including TSP, PM10, PM2.5, SO2,
H2S, methyl bromide and meteorological data – not every site
monitors every parameter.
The first 12 months of
monitoring data showed the Mount Industrial area was in breach of the National
Environmental Standards for Air Quality (NESAQ) for PM10 exceedances
(one permitted in a 12-month period). An application to declare the Mount
Industrial Area as a gazetted airshed was made and confirmed in November 2019
when the Mount Maunganui Airshed (MMA) was declared a polluted airshed, based
on PM10.
The gazetting of the polluted
airshed meant Bay of Plenty Regional Council was in non-compliance with the
NESAQ and was required to put measures in place to bring the airshed into
compliance with the existing legislation. Regional Council identified that to
achieve compliance would involve engaging with all stakeholders and this led to
the creation of the Mount Industrial Programme as well as establishing several
council sponsored community and industrial groups such as the Mount Industrial
Network and the Mount Maunganui Air Quality Working Party.
Business and industry were
identified as key contributors to air pollutants in the MMA and it was
essential to have business on board to make changes to site set-up (sealing
unsealed industrial land, limiting heavy vehicle movements, employing sprinkler
systems, and regularly sweeping dusty sites, constructing wind fences and
employing auto-close doors on warehouses) as well as updating scrubber
technology on industrial chimneys and reducing overall outputs to the
atmosphere.
The initiatives put in place
have seen a dramatic reduction in detected levels of PM10 in the
airshed, as highlighted in the following table.:
Table
1: Recorded PM10
exceedances by financial year, 2018-2023
|
Financial Year
|
PM10 exceedances
recorded
|
|
2018-19
|
7 (data started in Nov 2018)
|
|
2019-20
|
19
|
|
2020-21
|
4
|
|
2021-22
|
5
|
|
2022-23
|
2
|
1.2 Legislative
Framework
The
Mount Maunganui Airshed was gazetted as a polluted airshed under the NESAQ
Regulations 2004, coming into effect in November 2019. The gazetting was based
on breaches of the limits for fine particulate matter, PM10. As per
the regulations, five continuous years with no NESAQ PM10 breaches
must be recorded for the polluted status to be reviewed. Whilst year on year
the number of PM10 breaches recorded has been reducing, we have yet
to record a year since the airshed was gazetted with no breaches of the NES
regulations.
1.3 Alignment
with Strategic Framework
|
A Healthy Environment
|
We
develop and implement regional plans and policy to protect our natural
environment.
|
|
A Vibrant Region
|
We work
with and connect the right people to create a prosperous region and economy.
|
|
The Way We Work
|
We look
to partnerships for best outcomes.
|
The work in the MMA relates to a
range of community outcomes and there are two related Long Term Plan key performance
indicators (both indicators are on track at the time of writing this report):
1. Number of exceedances of air quality limits in priority airsheds is
less than 21 (and a reduction year on year)
2. Air quality exceedances where investigations started within 10
working days
1.3.1 Community
Well-beings Assessment
|
Dominant Well-Beings Affected
|
|
þ Environmental
Medium
- Positive
|
þ Cultural
High -
Positive
|
þ Social
High -
Positive
|
þ Economic
Medium
- Negative
|
Local communities, including
hapū connected with Whareroa Marae, residents of Mt Maunganui from Pilot
Bay to Ōmanu and users of sport and recreation facilities have expressed
their desire to live and play unaffected by industrial activity and emissions.
Overall, a reduction in industrial discharges will have positive benefits on
environmental, cultural, and social well-beings, but is likely to come at an
economic cost. In addition, a converse impact on economic wellbeing may be felt
if new industries do not develop or existing industries are forced to move away
from the area.
2. Updates
– September 2022 to February 2023
2.1 PM10
monitoring and exceedances in the current reporting period
The full list of PM10
exceedances since the monitoring network was established is included in Appendix
1. Investigations of PM10 exceedances continue to show a single
pollution source is seldom the cause and the cumulative effect of emissions
from multiple sources is generally responsible.
During this reporting period two
PM10 NES exceedances were recorded. On 1 December 2022 elevated dust
levels were detected throughout the day at the Rata Street monitoring site.
Compliance staff were on-site periodically during the day and observed plumes
of dust blowing over a neighbouring unsealed site. Additionally, security
camera footage was obtained from surrounding businesses which showed activities
on the unsealed site contributing to the dust clouds observed. The
investigation is on-going to determine this was the sole source of the
exceedance detected.
On 31 January 2023 a breach of
the NES was detected at the Aerodrome Road monitoring site. Staff responded to
alarms from this site at different times during the day and could observe no
activities out of the ordinary nor visible dust in the air. Records of truck
movements have been received from RMD transport as well as video footage of the
truck wash in action. There appears to be some correlation between high PM10
readings and the use of the nearby truck wash (and we know water vapor can
trigger the dust censors), however, to date there is nothing categorical to
determine why an exceedance was recorded on this day.
Update on August 2022
exceedances: An application to the Ministry for the Environment for exceptional
circumstances was submitted for a number of exceedances detected across the
network in August. The application was approved as the exceedances were caused
by very high levels of airborne sea-salt, a natural occurrence. These
exceedances have been removed from the annual total for the 2022/23 annual
reporting.
2.2 Mount
Maunganui Air Quality Working Party
The Mount Air Quality Working Party held
its first hui of 2023 on 22 February.
Please refer to Appendix 2 for full meeting minutes
and presentations.
Priority One presented on the findings of an
industrial confidence survey undertaken across businesses operating in the
Mount Maunganui air-shed. The survey aimed to determine how engaged business
and industry were with the potential limitations of operating in a polluted airshed,
current environmental awareness and whether future alternative industrial
locations would entice business to move away from the Mount Industrial area.
Waka Kotahi gave an up-date
presentation on progress with a business case being which will identify the
widest range of solutions to suit the widest range of user groups to undertake
major upgrades to Hewletts Road and Totara Street as well as connecting a
multitude of cul-de-sacs that run off Totara Street and Hull Road. The
aim is to increase and improve traffic flow and transport choices through the
Mount Industrial area.
Karen Parcell (BoPRC) updated the group on the key
findings of the interim Environment Court decision regarding Plan Change 13
rules around matters pertaining to Bulk Solid Material (BSM) handling and the
impacts this may have on business development and expansion in the Mount
Maunganui air-shed. The final court judgement is expected mid-year.
Tauranga City Council gave an over-view of a recent
legal opinion received regarding existing use rights of industry to operate in
their current locations within the Mount Maunganui industrial area. Current
legislation would mean it is extremely difficult for a city council to
extinguish existing industrial land use rights and this could not be done under
a city or district plan change.
Working Party members discussed the difficulties faced
by community groups and industry staff volunteering their time to work on the
issues and represent communities in the Working Party. A request was made for
funding and additional support to be provided for a community representative to
work on the issues.
A dedicated webpage for the Mount Maunganui Air
Quality Working Party, where reports, meeting agendas and minutes are stored
can be viewed at: www.boprc.govt.nz/mount-industrial-air-quality-working-party.
2.3 Pollution
Hotline Complaints Response
From 1 September 2022 to 13th February
2023, 57 calls were received through the Pollution Hotline relating to events
within the Mount Industrial Airshed. Of these 41 related to air quality with 19
of these relating to odour. Refer to the table below for specific details.
All urgent calls were responded
to within 12 hours and non-urgent calls responded to within three working days.
Table
2: Pollution Hotline calls by
category, 1 Sept 2022 – 13 Feb 2023
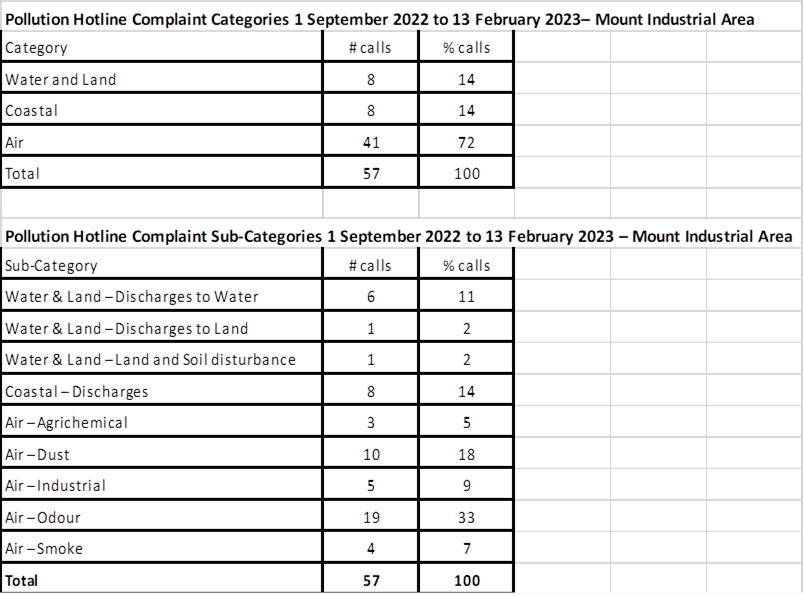
2.3.1 Odour
and pro-active monitoring
Odour continues to dominate service requests through
the Pollution Hotline, although since the departure of Ziwi Petfoods the number
of odours complaints has noticeably reduced. The current main odour sources
have been identified and since November the compliance team undertakes daily
pro-active odour assessments of key industrial locations which involves
undertaking an outdoor odour assessment of known odour producing business
locations. Within the Mount Maunganui airshed these include:
· Storage
areas for Palm Kernel Expeller (PKE) and other bulk stock foods. These tend to
be concentrated around De Havilland Way and Newton St and as well as odour are
a source of dust complaints
· Bakels
Edible Oils has occasional cooking oil odours at times of production
· Greenmount
Foods, odours mainly isolated to cooking seafood stocks and poor storage of
waste food products outside the factory
· Ballance
& Lawter with consented sulphur dioxide discharges
· Higgins
& Allied Asphalt, primarily when batching asphalt mix
· Penguin
Pools and their use of chemicals and resins in the fibreglass pool
manufacturing processes
· Tanks farms
mainly at the Totara Street end of Hewletts Road, can be odourous when tank
filling is being undertaken
Additionally,
a WhatsApp group has been set up between Clear the Air Community Group and
asphalt producers so members of the public can contact Allied and Higgins
directly when they are detecting bitumen odours in residential areas. This
allows the bitumen manufacturers to determine the processes being undertaken on
their sites at the time a message is received and respond directly to the
community. The Report-It App has also been promoted for use within the Mount
Maunganui residential community to give them an alternative method of reporting
any pollution issues to the compliance team, rather than making a call to the
Pollution Hotline.
2.4 Consents
There are
currently eight businesses that have applied for discharge consents within the
Mount Industrial air shed. There has been no change in the status of these
applications since last reported. Many of the new applications are on hold
pending the final Environment Court Decision on Plan Change 13 (Air Plan).
Appeal parties are working through the interim decision released in January
2023. Once the final decision is made, these applications will progress,
provided there are no further appeals. All other applications are awaiting
further information to be provided and/or consultation regarding cultural
effects.
Allied
Asphalt are not applying for a like-for-like renewal of their existing consent
but intend to install a new plant. This will also trigger consent requirements
from the City Council due to the proposed stack height.
Consents
currently in process are:
Renewals:
· Waste Management
· Lawter
· Allied Asphalt
· Higgins
New applications:
· HR Cement
· TPT Forests
Ltd
· Matariki
Forests
· Timberlands
Ltd
2.4.1 Fumigation
– Genera consent application
Genera
Limited applied for the ‘Discharge of fumigants; Methyl Bromide, Phosphine
and Ethanedinitrile (EDN), to air at the Port of Tauranga.
(Resource Consent RM 19-0663).
The use of methyl bromide, including re-capture, has been applied for in
accordance with the 2021 EPA re-evaluation and decision on the use of methyl bromide.
EDN is a new fumigant and is intended to largely replace much of the methyl
bromide used as it is not an ozone depleting gas and does not require
recapture, although it is more flammable.
The
application has been processed by an independent consultant and technically
reviewed by Regional Council staff. The public hearing on the resource consent
application was originally scheduled for the week beginning Monday 13 February
2023. Following a request from the applicant, the Hearing Panel (Independent Commissioners:
John Iseli, Alan Watson and Shane Solomon) have re-set the hearing for the week
of 12 June 2023 or as soon as practicable thereafter.
2.5 Policy
Matters
Since the last report there has been little change to
the development of the high-level framework of provisions for Plan Change 18
– Mount Maunganui Airshed (PC 18). This is due to the recent release of
the Environment Court’s interim decision for PC 13, and a series of
developments involving central government legislation and external agencies,
which continue to affect its preparation. However, the interim PC 13 decision
has given Council staff direction on the likely final form of that Plan Change,
which will in turn guide the approach of PC 18.
To ensure consistency within the
Regional Natural Resources Plan, PC 18’s progress will be limited until
the final decision of the PC 13 appeal. Council staff had also required clarity
in relation to the NESAQ, which is in the process of being amended by the
Ministry for the Environment. It had been understood that the NESAQ amendments
were themselves reliant on Ministry analysis of two other sources of
information: the “Health and Air Pollution in New Zealand” (HAPINZ)
study, which was released in July 2022, and the World Health Organization’s
“Global Air Quality Guidelines”, published in September 2021.
Council staff have been in regular contact with the Ministry to seek
updates on the timing of the possible release of the NES amendments. The
Ministry website initially suggested that the NES would be released by mid-2021
but, in November at the Mount Maunganui Air Quality
Working Party hui, Ministry staff indicated that NESAQ
provisions will be included in the first National Planning Framework, which is
only in very early stages of development, and will be rolled out in stages. It
was suggested that this reform could take up to ten years to become fully
operative and that, in the interim, existing standards will remain the status
quo.
Staff will move ahead to implement the Court’s
direction in relation to PC 13, followed by the development of PC 18. These changes
will be discussed with key stakeholders in the Airshed, and their feedback
sought.
2.6 Dust
(PM) Monitoring in Mount residential areas
Staff met with Clear the Air
community representatives to discuss their preferred options for monitoring in Mount
Maunganui residential and recreational areas. Support was expressed for a
network of air monitors the same or similar in concept to the Clarity low-cost
air monitors that were trialled by Regional Council in January 2022. Such a
network will complement the high-quality data we receive from the existing
network.
The
advantages of the smaller Clarity type units are that a network can be
established across a wider area, data can be readily accessed online, the units
are easily installed on existing infrastructure and are solar powered. As the
Clarity type monitors are of lower data quality than the existing NESAQ
compliant monitors located in the Mount Industrial zone the data will be used
to show overall trends and provide broad indicators of real-time air quality
along with health-based guidance rather than that to determine compliance with
the NESAQ. The monitors are currently being calibrated against reference
equipment in the industrial zone, will record data on levels of PM10,
PM2.5 and NO2 and will be deployed at locations across the Mount
Maunganui residential area. A communications plan, including a webpage to
deliver results from the monitors, is currently in development. It is
expected that the results from the monitoring network will be delivered to the
community in Q2/2023.
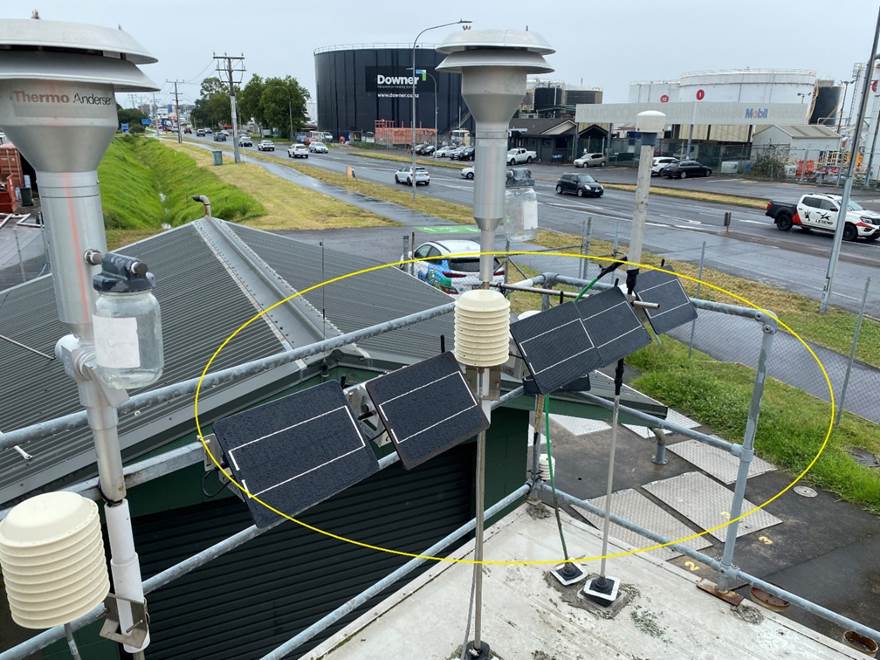
Figure 1: Five Clarity air monitors deployed for calibration at
the Totara Street reference site.
3. Port of Tauranga – Hewletts Road
Log Yard stormwater treatment
upgrades
Port of Tauranga has been successfully refining the
stormwater treatment system at the Hewletts Road Log Yard over the past several
years to improve stormwater quality and environmental outcomes. The Hewletts Road Log Yard,
which is located off Port, on the corner of Hewletts Road and Totara Street,
has benefited from improved stormwater quality because of the works. This has included utilisation
of more efficient flocculant treatment and reductions in water and bark contact
time to reduce stormwater staining/discolouration by re-countering the
stormwater swales.
In addition, the Port has committed to further system
upgrades to provide additional stormwater polishing before discharging to
receiving environments.
Future
upgrades will:
· Result in
better utilisation of stormwater discharge to land (infiltration) by
recirculating stormwater from settlement ponds to the upstream sand-based
swales between rain events,
· Reduce the
volume of water that will be discharged to water by creating more storage in
the stormwater ponds,
· Provide for
improved heavy metals reduction by utilising crushed mussel shell filtration,
and
· Better
enable recover of gross solids, namely bark, from the swales, which will
increase efficiencies of the stormwater system.
Aspects of this work have been delayed due to the wet
summer weather, this has created some uncertainty around implementation dates
for the upgrades at this time, however, works will go ahead if opportunity
presents.
Stormwater treatment and management improvements have
also been implemented at the Tauranga Container Terminal and the Mount
Maunganui Wharves over the past five years with monitoring showing improved and
compliant stormwater discharges from these sites.
In addition to this, works are also underway to identify opportunities for
further stormwater improvements at the Mount Maunganui Wharves.
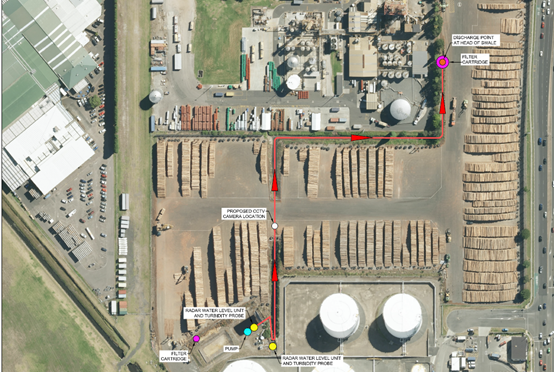
Figure 2: Schematic of stormwater discharge and treatment in the
Hewletts Road log-yards.
Figure 3: Port
of Tauranga’s Environmental Advisor, Fenna Beets, celebrating a sample
collected from the Hewletts Road Log Yard stormwater system at the final
discharge point, following full stormwater treatment.
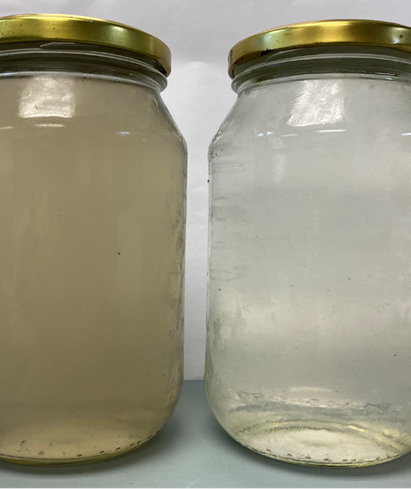
Figure 4: Stormwater
samples collected from the Hewletts Road Log Yard stormwater system. Left –
Stormwater sample collected mid treatment; Right –
Stormwater sample collected at final treatment before discharge.
3.1 Latest
Port innovations to improve yard sweeping and bark collection
Bark and
dirt that is lost to the ground during logs handling at the Port is
cleaned/collected from the log yards by log yard cleaning contractors. The log
yard cleaners use bark plough machines and vacuum sweeper trucks to undertake
this work. Aspects of this process can be dusty if not appropriately managed.
Over recent years significant amounts of work have been undertaken by the log
yard cleaners and the Port to minimise dust generation from this work
including:
· increase the
number of sweeper trucks to three,
· increase
sweeper truck use hours and improve sweeper truck use efficiencies,
· increase
training and supervision of sweeper truck and bark plough operators,
· increase water
suppression use inside and outside of the sweeper trucks to dampen dust,
· introduce
water suppression systems to the bark plough, and
· introduce
water suppression systems to the bark storage facility.
A custom bark collection
trailer which has lower sides and an in-built water suppression system to
further minimise fugitive dust when loading bark is due to be introduced in the
near future.
4. Considerations
4.1 Risks
and Mitigations
Air emissions
from industrial activities in the Mount Maunganui industrial area and in
particular activities on Port of Tauranga land are identified as a key risk for
Council with several mitigation measures in place. This report is an
information only update and no additional risks have been identified.
4.2 Climate
Change
The matters
addressed in this report are of a procedural nature and there is no need to
consider climate change impacts.
4.3 Implications
for Māori
Ngāi
Tukairangi and Ngāti Kuku ki Whareroa are the Ngāi Te Rangi hapū
affiliated with Whareroa Marae and with whom Regional Council staff have been
endeavouring to foster closer relationships to ensure council actions will have
direct and positive impacts on the Taiaho Place and papakainga communities.
Staff have also been working hard to ensure the communities relate to agencies
such as Ministry for the Environment and Toi te Ora and surrounding business
and industry.
The
establishment of the Air Quality Working Party has provided another platform
for engagement with iwi and hapū and for their concerns to be heard around
a wider table. This is a space of ongoing commitment from all parties involved
as there is clearly still a degree of distrust of government agencies and actions
held by the Whareroa community.
4.4 Community
Engagement
|

|
Engagement with the community is not required as the report
is an update only and no decisions are required.
|
4.5 Financial
Implications
There are no
material unbudgeted financial implications and this fits within the allocated
budget.
5. Next
Steps
Staff will continue to update this Committee on all
work underway to improve air quality in the Mount Maunganui Industrial Area.
There is a wider focus on all environmental discharges and ensuring the minimal
impact on human health resulting from industrial activity. The six-monthly
updates on these works requested by the Minister for the Environment from Bay
of Plenty Regional Council continues to be provided with the most recent sent
to the Ministry in December 2022.
Attachments
Attachment 1 - Table of all PM10 exceedances PDF ⇩
Supporting Document 1 - Mount Air Quality Working Party meeting
minutes and presentations from Wednesday 22 February 2023 ⇩
Monitoring
and Operations Committee 7 March 2023
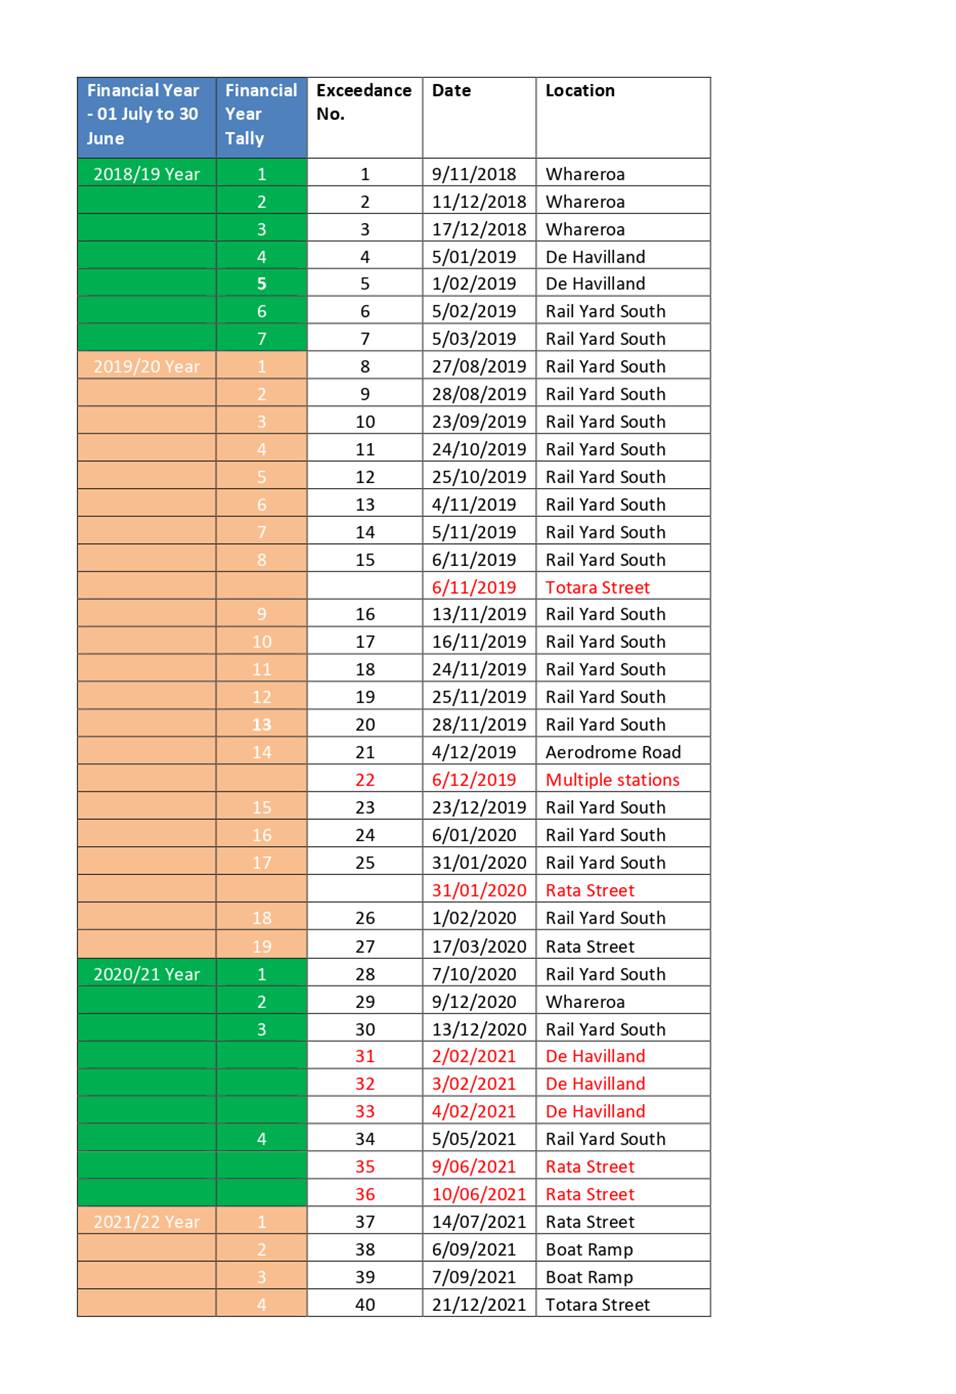
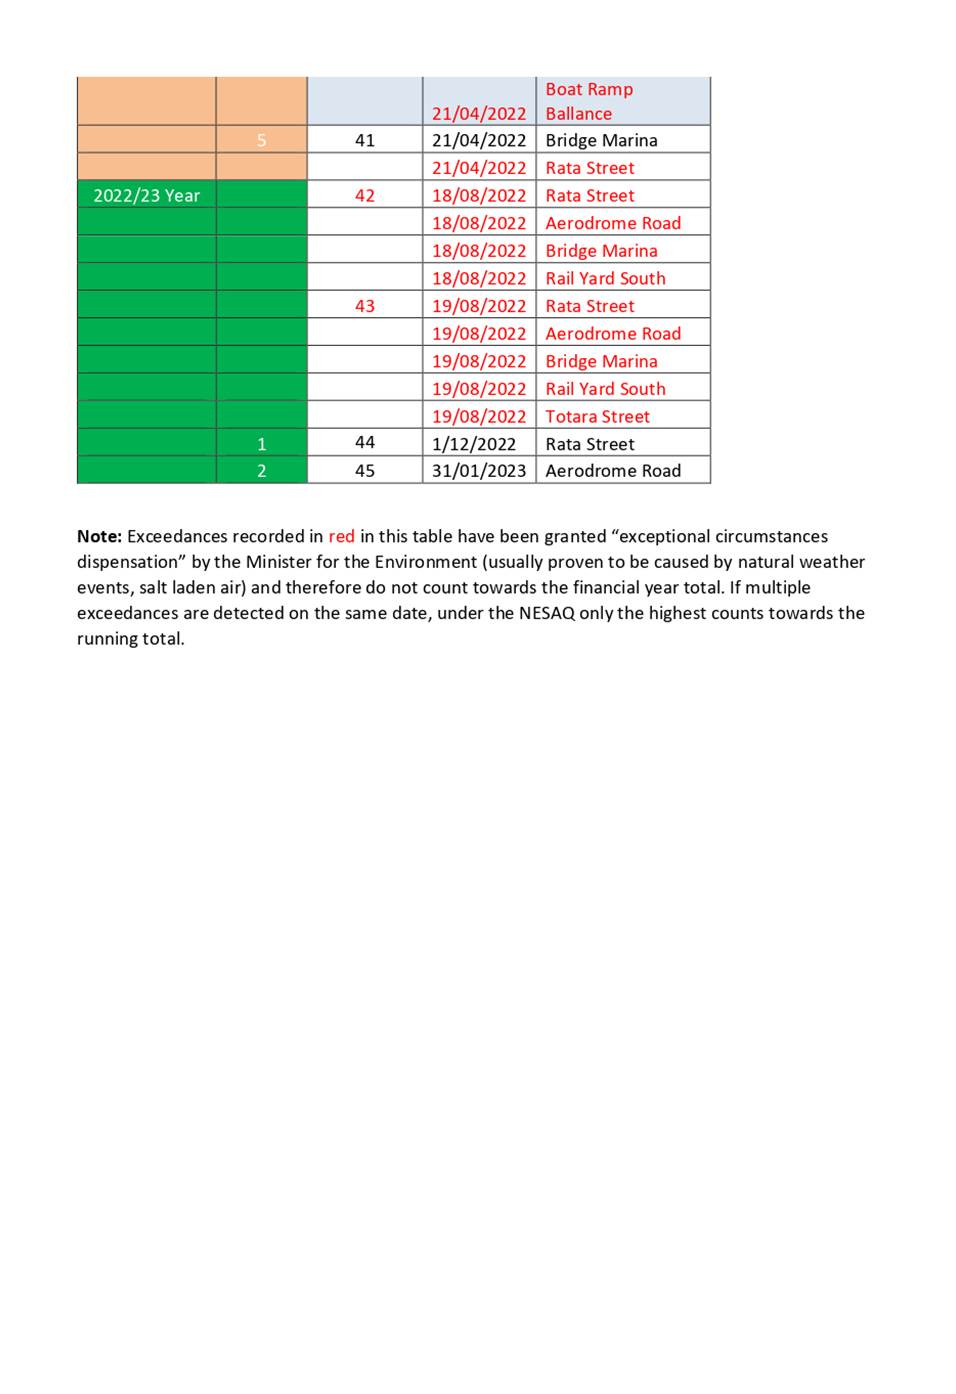
Monitoring and Operations
Committee 7 March 2023
Item 6.7
Supporting
Document 1
Mount Air Quality Working Party meeting
minutes and presentations from Wednesday 22 February 2023
|
|

|
|
|
|
Report To:
|
Monitoring and Operations Committee
|
|
Meeting Date:
|
7 March 2023
|
|
Report Writer:
|
Paula Chapman, Project Manager
|
|
Report
Authoriser:
|
Chris Ingle, General Manager, Integrated
Catchments
|
|
Purpose:
|
To provide the Operations Committee with
information on recent
significant weather events and the impacts for the Council.
|
|
|
|
Weather Events, January - February
2023
|
Executive Summary
There have been
three significant weather events in 2023 which have impacted New Zealand
cities and communities, in some cases severely. For the Bay of Plenty, the
Auckland Anniversary weekend weather event had the most significant impact.
Cyclone Hale and Cyclone Gabrielle resulted in only minor impacts for the Bay
of Plenty.
During the Auckland
Anniversary event the Kaituna River reached the highest level recorded since
the Kaituna Control Scheme was completed and various rural stopbanks
overtopped where the conditions exceeded the level of service.
Recent weather
events were likely exacerbated by the preceding antecedent weather conditions
which resulted in saturated soils and elevated groundwater levels.
There will be costs
associated with immediate response actions for the Kaituna Control Scheme
maintenance budgets. Staff are currently assessing scheme asset damage and
repair.
|
Recommendations
That the Monitoring and Operations Committee:
1 Receives the report, Weather Events, January -
February 2023.
1. Introduction
Nationally there have been three significant weather events
in January and February 2023 which have impacted New Zealand cities and
communities by varying degrees: Cyclone Hale 10 January, Auckland Anniversary
Weekend weather event 27-31 January and Cyclone Gabrielle 13-15 February.
For the Bay of Plenty the Auckland Anniversary weekend
weather event has had the most significant impact within the Kaituna Catchment
Control Scheme. Thankfully Cyclone Hale impacts were negligible, and Cyclone
Gabrielle resulted in minor effects within our river schemes.
The Council’s flood management and monitoring team
supports a range of agencies during a flood event, from emergency services,
lifelines groups and local councils. The dedicated flood room and systems are
specially designed to support the flood team’s emergency flood response.
The flood room operates in two modes, monitoring (duty Flood Manager is
on call 24/7 maintaining an overview of river levels, weather patterns and
forecasts affecting the Bay of Plenty) and activated (the entire flood
team gathers in the flood room, and operations staff are deployed to assist in
the field).
1.1 Legislative Framework
Under the Local Government Act 2002, regional authorities
are responsible for the provision and control of river scheme assets. The
Council manages and maintains the River Schemes under the Soil Conservation and
Rivers Control Act 1941 and in keeping with its Rivers and Drainage Asset
Management Plans. These plans include levels of service and flood protection that
the Council provides for the community.
1.2 Alignment with Strategic
Framework
|
Safe and
Resilient Communities
|
We support community safety through flood
protection and navigation safety.
We work with our partners to develop
plans and policies, and we lead and enable our communities to respond and
recover from an emergency.
|
|
A Vibrant Region
|
We invest appropriately in infrastructure
to support sustainable development.
|
|
The Way We Work
|
We deliver value to our ratepayers and
our customers.
|
1.2.1 Community Well-beings Assessment
|
Dominant
Well-Beings Affected
|
|
þ Environmental
Low - Negative
|
¨ Cultural
Low - Positive
|
þ Social
Low - Negative
|
þ Economic
Low - Negative
|
2. Weather Events
2.1 Auckland Anniversary
Weekend Storm Event (27-31 January)
2.1.1 Flood Management and Monitoring
Response
Heavy rains and strong winds were forecast in the lead up to
the long weekend. Described as a subtropical moisture plume the conditions were
predicted as warm, humid, rainy, and stormy with heavy rain possible causing
flooding in already saturated parts of the North Island.
A heavy rain warning was issued on Friday 27th January for
the region west of Whakatāne and Rotorua with 130 to 180 mm of rain
expected about the ranges, and 70 to 110 mm elsewhere. A severe thunderstorm
watch was also issued.
The Duty Flood Manager instigated controlled spilling from
the Matahina Dam at 10.30am Saturday morning (28th January) as a cautionary
response to the heavy rainfall warning, in conjunction with Manawa Energy. As
flows into the lake declined on Sunday 29th January spilling was reduced and
the lake level raised to normal operating levels over the following couple of
days.
The Whakatāne River reached its first warning level
early Saturday afternoon (28th January) before receding Sunday Morning.
The Paraiti River (Mangorewa) reached 1st and 2nd warning at
early hours of the morning Saturday (28th January).
The Ngongotahā Stream reached warning level Sunday
morning (29th January). The stream rose rapidly in response to a second night
of rainfall in Rotorua. There was minor overtopping of the riverbanks around
Brake Road and in the Brookdale Place area but no reports of damage as a
result. The stream receded quickly in the afternoon and early evening.
The Kaituna River reached its 1st and 2nd warning levels
early Saturday morning (28th January). The Kaituna River rose further overnight
to reach the highest level recorded since the Kaituna Control Scheme was
completed. There were various overtopping events reported for the rural
stopbank areas where the conditions exceeded the level of service. Several
seepage issues were also reported.
The river level recorded at Kaituna at Te Matai measured
4.778m at 7.25 am Sunday morning (29th January) as shown in figure 1. This is
the highest level recorded since data collection began in 1955.
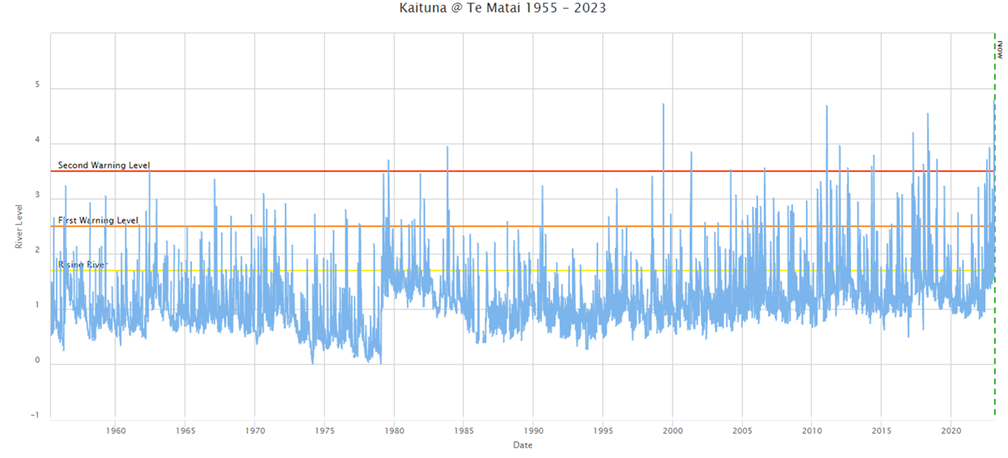
Figure 1 River Level
Kaituna @ Te Matai since 1955
The Flood Management Team supported local authority
responses by providing weather, rainfall, river and coastal information and
advice to assist local decision making.
The stream levels in Ngongotahā were very close to
evacuation triggers and flood management staff will be liaising closely with
Rotorua Lakes District Council on the provision and analysis of stream level
data, to inform decision making in future events.
2.1.2 Operations Team Response
Rivers and Drainage Operations respond to extreme weather
events to ensure flood protection assets can operate effectively and to monitor
infrastructure during a flood event. The team ensures flood gates are
operational, scheme pumps are running and maintained, temporary pumping is in
place where required and that the situation is being monitored on the ground as
well as from the flood room.
The consistent spells of heavy rain that fell over the past
eight months have kept the Rivers and Drainage Operations team extremely busy
in the field, even prior to these significant weather events of early 2023. For
an extended period, staff have been managing elevated water levels in drainage
schemes throughout the region. The recent rain events come at a time when
drainage scheme areas such as the lower Kaituna were already well saturated and
even moderate rainfall events have had a significant impact on some properties.
The team’s resources have been mainly focused in the
lower Kaituna drainage area and Ngongotahā Stream, regarding response and
recovery.
In the Upper Kaituna, work involved sandbagging and debris
removal in the Ngongotahā Stream and the Puarenga Stream. Staff also
assisted retrieving two horse trucks from wet paddocks close to the stream at
the A&P showgrounds.
In the Lower Kaituna, multiple staff and contractors were
busy checking and refuelling pumps and cleaning screens. Extra pumps were
required, with 6 mobile emergency pumps installed for the duration of the event
and left in place to keep levels down in preparation for Cyclone Gabrielle
rainfall.
2.1.3 Damage to River Schemes Assets
Damage has included the destruction of two grade control
structures in the Ohineangaanga River, along with some riverbank, canal, and
drainage system erosion. Staff are currently undertaking flood damage
assessments in the upper and lower Kaituna. It is anticipated that some of
these areas will need to be rock armoured to prevent further erosion and to
manage future risk to community assets.
2.1.4 Community impacts
There were substantial impacts for community assets
including the Washer Road Bridge, the Washer Road Rail Bridge, FirstGas main
supply, the KiwiRail line into Te Puke and the No. 4 Road Bridge. BOPRC staff
have worked alongside utility and infrastructure owners to support both
temporary and permanent repairs. This has included site
meetings, advice on site works, and review of repair plans with Westlink BOP,
KiwiRail and FirstGas.
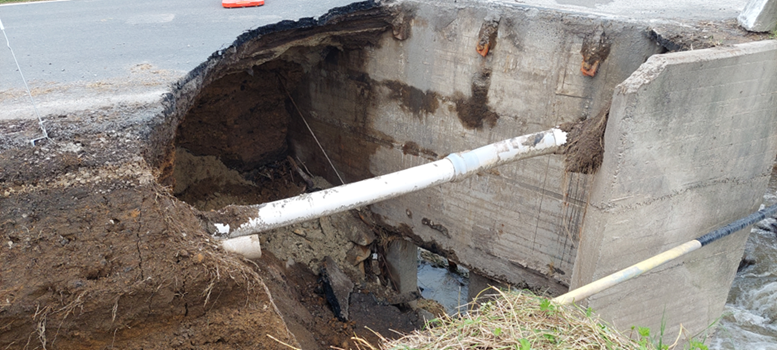
Photo 1 - Washer Road
Bridge Damage
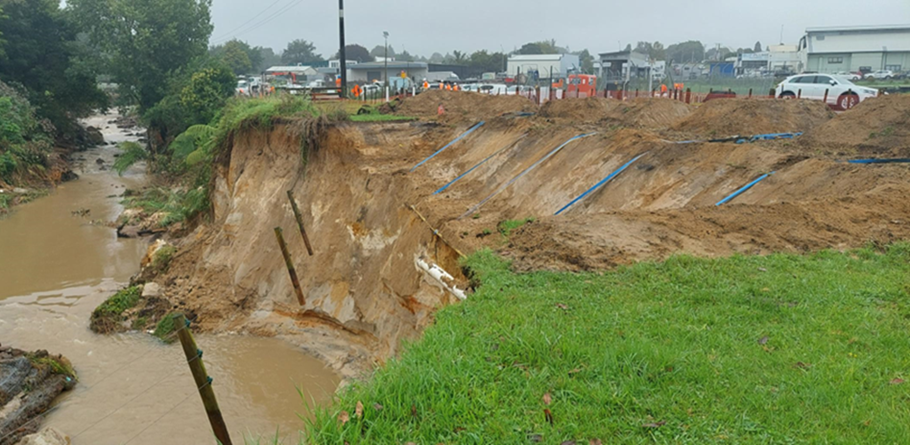
Photo 2 - FirstGas Line
exposed at Ohineangaanga River, BOPRC undertook work within the river to reduce
the possible impact of Cyclone Gabrielle for the precarious gas line prior to
reestablishment of a new line.
2.1.5 Outside of scheme impacts
Significant debris build up (trees, vegetation, posts, silt,
and rubbish) and riverbank erosion occurred in streams and rivers outside of
the managed river scheme. This has had a major impact for productive
horticulture properties alongside the rivers.
Debris removal was undertaken in the Ohineangaanga River in
the few days between Auckland Anniversary and Cyclone Gabrielle. Over 200 tonne
of debris was pulled out of the stream and stacked clear. This preventive work
was undertaken to ensure the material did not travel downstream into the scheme
area during Cyclone Gabrielle, causing damage to council and community
infrastructure.
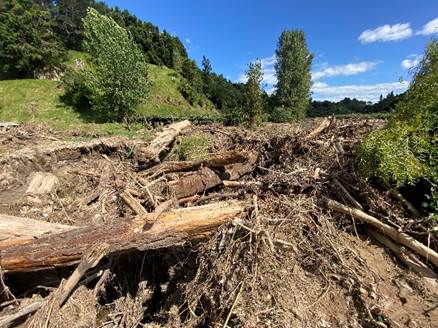
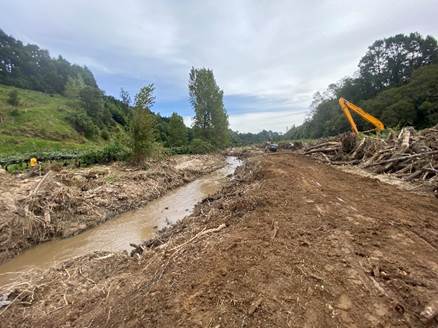
Photos 3 and 4 -
Ohineangaanga River, debris build up following Auckland Anniversary Weekend
Weather Event
2.2 Cyclone Gabrielle (13-15
February)
2.2.1 Flood management, monitoring
response, and impacts
The flood management and operations teams were fully
resourced and prepared for Cyclone Gabrielle. The team supported local
authority responses through the analysis of information, briefings, situation
reports and advice. Specific advice was provided on coastal areas susceptible
to inundation. Local Authorities used this as a basis for evacuation decisions.
Fortunately, the coastal wave action, powerful winds and
rainfall predicted did not eventuate to the extent that was forecasted; and
impacts were mainly associated with slips due to saturated soils, wind damage, fallen
trees, power outages and continued erosion at coastal sites such as Waihī
Beach.
2.3 Rainfall
While the Auckland Anniversary weekend and Cyclone Gabrielle
events are significant, the impacts were likely exacerbated by the preceding
antecedent weather conditions including 8 months of higher-than-normal
rainfall, resulting saturated soils and elevated groundwater levels.
The high rainfalls are demonstrated in Figures 2 and 3 which
show cumulative rainfall over a water year period (July through to June) for
Rotorua and Tauranga representative rain gauges. These gauges show rainfall
totals well above any recorded previously, this includes the Rotorua at
Whakarewarewa gauge which has been in operation since 1901. These are similar
results to rain gauges across the region.
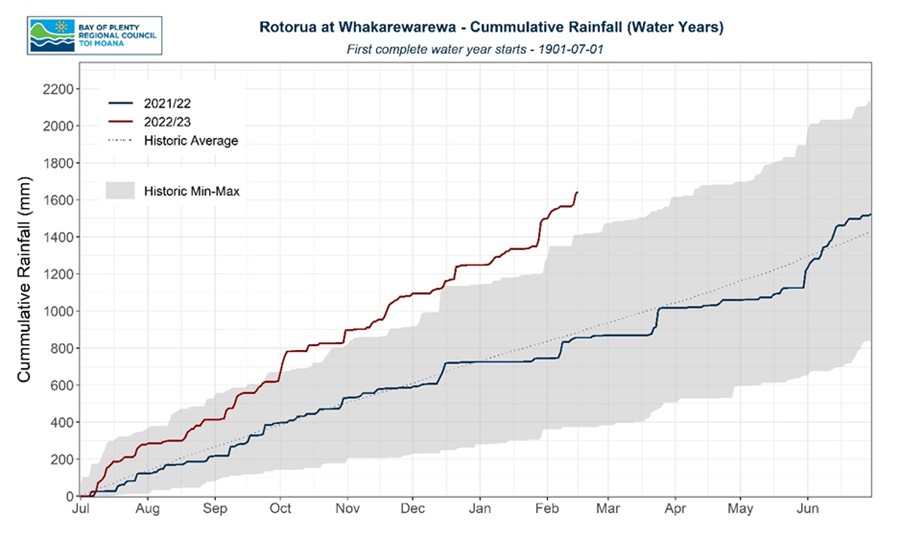
Figure 2 - Representative Rotorua rainfall
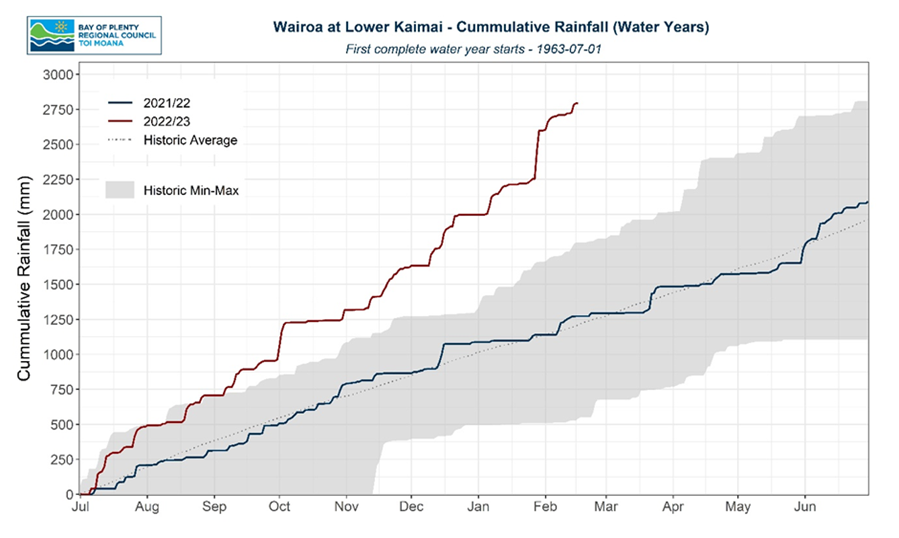
Figure 3 - Representative Tauranga rainfall
The Auckland Anniversary rainfall event was particularly
notable in the western and central parts of the region for both its intensity
and its duration.
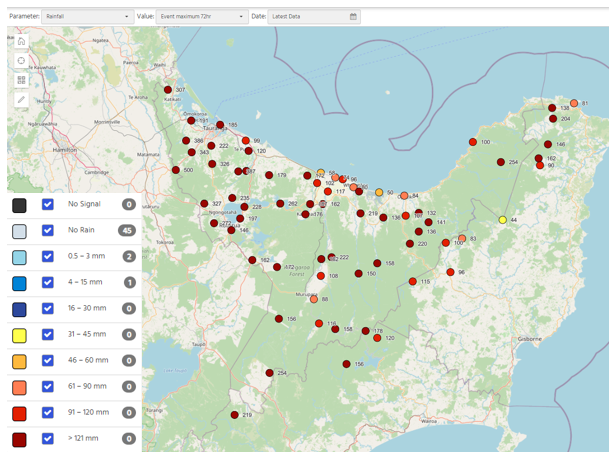
Figure 4 - Maximum 72-hour rainfall totals 27 January -
4 February
Of note are the following:
· the 500mm of
rain that fell in a 72-hour period at Waikato Regional Council’s rain
gauge at the top of the Kaimai ranges.
· the 300mm+
of rain that fell in a 72-hour period at several of the lower altitude gauges
in the western and central parts of the region.
· the rainfall
present at the top of the Rangitāiki catchment, which while not comparable
with the quantities measured elsewhere, was significant for that
locality.
2.4 Lake levels
This consistently high rainfall since June 2022 has resulted
in rising lake levels across the region. The plots provided in Figure 5 shows
the full lake level history for Lake Rotorua overplotted with a dashed line
representing current lake level as of 15 February 2023. Additional lake level
graphs are provided as Attachment 1. While lake levels are currently high
across all lakes in the region, similar peaks have been reached at times over
the past 20 years.
When looking at full period lake level plots as provided, it
is not unusual to see higher levels in the early record when control structures
or overflow paths were not present.
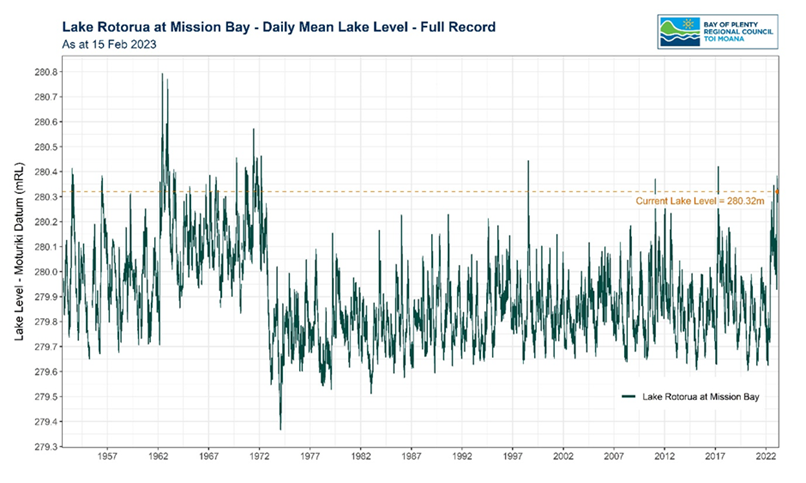
Figure 5 - Lake Rotorua level
2.5 Wave buoy
The Pukehina wave buoy recorded a maximum wave height during
Cyclone Gabrielle of 8.68m as represented in Figure 6. The actual maximum
wave height may be slightly larger than this as data transmission was lost from
the buoy near the peak of the event. Missing data will be recovered from the
buoy soon, as it is being returned to shore after its mooring was dragged a
kilometre during the event.
Barometric pressure from the Ōhope Golf course
meteorological station is also plotted on Figure 6 and shows a minimum air
pressure of 973hPa. The timing of the low pressure does not coincide with the
peak of the wave buoy due to the time it would have taken the centre of the
storm to move the equivalent distance between the sites of approximately
60km.
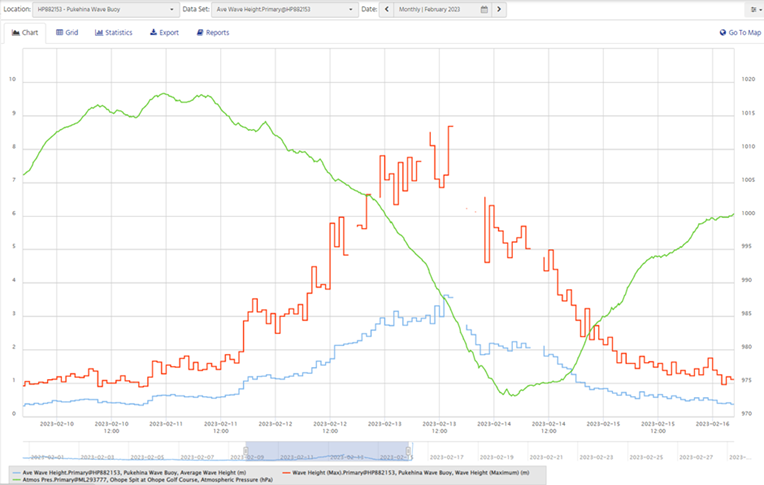
Figure 6 Pukehina wave buoy average (blue) &
maximum (red) wave heights and Ōhope barometric air pressure (green)
3. Considerations
3.1 Risks and Mitigations
The flood management and operations team provide information
and carry out actions that help to manage flood impacts for our communities.
Response and recovery work immediately following the Auckland Anniversary event
reduced risk and possible impacts of Cyclone Gabrielle for river scheme assets
and other public assets. Subsequent coordination with agencies optimised
outcomes for business, ratepayers, and the wider community.
3.2 Climate Change
The matters in this report are directly associated with
monitoring and reporting on present day climate change impacts.
Subsequent responses should consider long term sustainability given the ongoing
forecasted changes due to climate change, alongside the ongoing need to restore
and protect community assts and infrastructure.
3.3 Implications for Māori
The Council has a responsibility to manage the risks posed
by our major rivers including the region’s major flood control and drainage
schemes. Iwi and hapū have a strong interest in the long-term management
of our rivers and waterways. The flood mitigation and environmental work
undertaken by the Rivers and Drainage Activity are fundamentally of interest to
Māori, as kaitiaki.
3.4 Community Engagement
|

|
INFORM
Whakamōhio
|
To provide affected communities with balanced and
objective information to assist them in understanding the problems,
alternatives and/or solutions.
|
3.5 Financial Implications
The total financial impact of recent weather events for the
BOPRC is not yet known. There will be costs associated with immediate response
actions such as additional pumping, contractor, and machinery costs. Known
costs are estimated at $75,000 - $100,000, being additional costs within the
Kaituna Control Scheme maintenance budgets. Asset damage and repair is
currently being assessed however and further costs exposure is likely.
4. Next Steps
· Within-scheme
flood impacts will be assessed and reported to the Kaituna Control Catchment
Scheme Advisory Group
· Flood repair
financial implications will be reported back to Council for consideration.
· Staff
will continue to liaise with infrastructure and utility providers to ensure
best community outcomes.
· Staff will meet with Rotorua Lakes District Council to clarify their
needs for stream trigger levels.
Attachments
Attachment 1 - Weather Events, January - February 2023 Lake Levels ⇩
Monitoring
and Operations Committee 7 March 2023
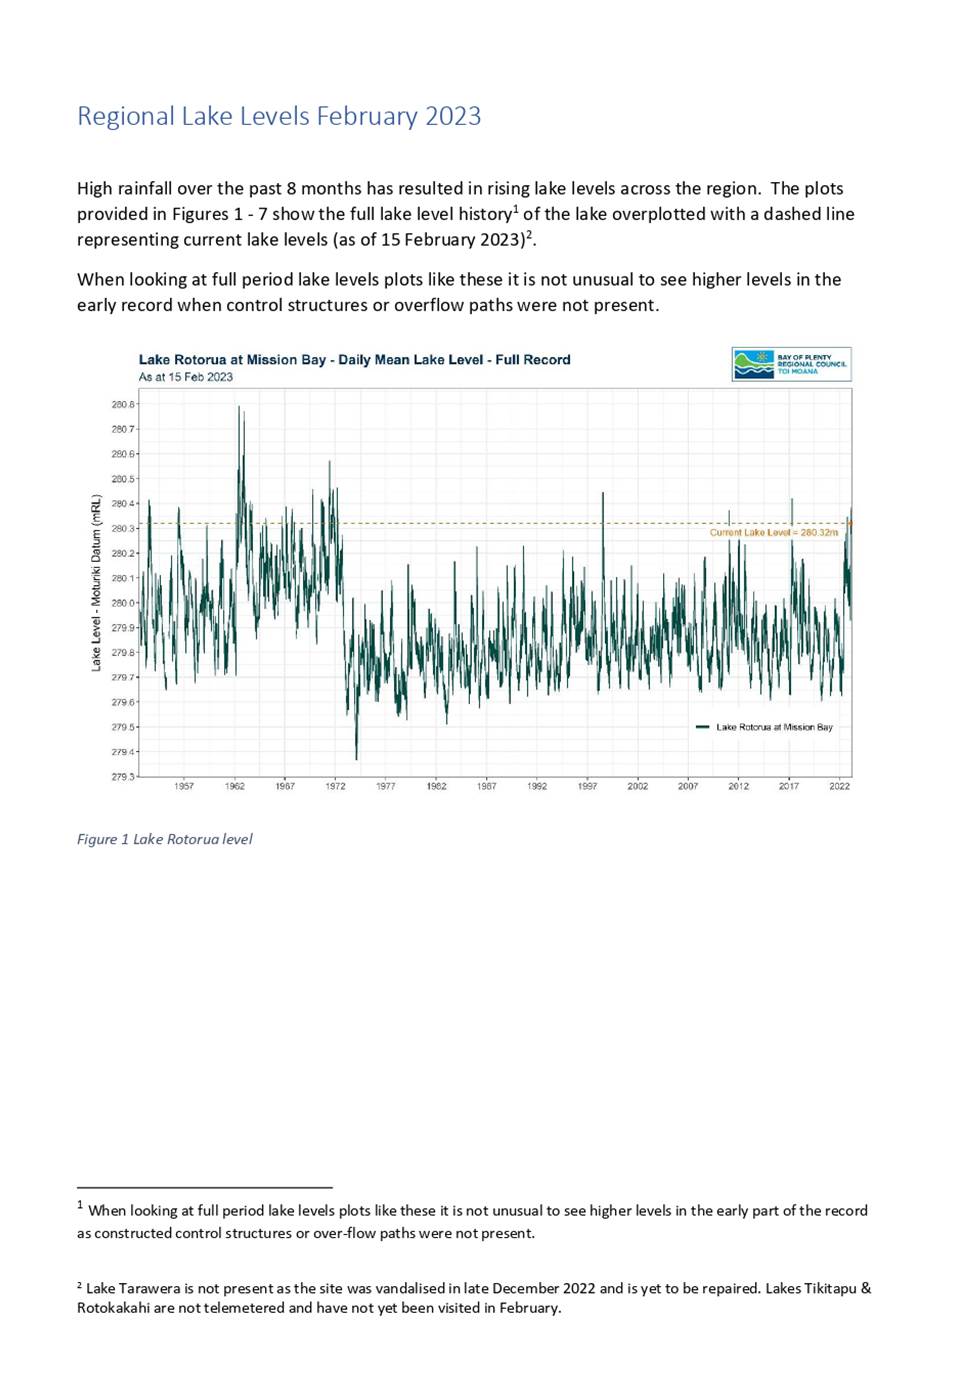
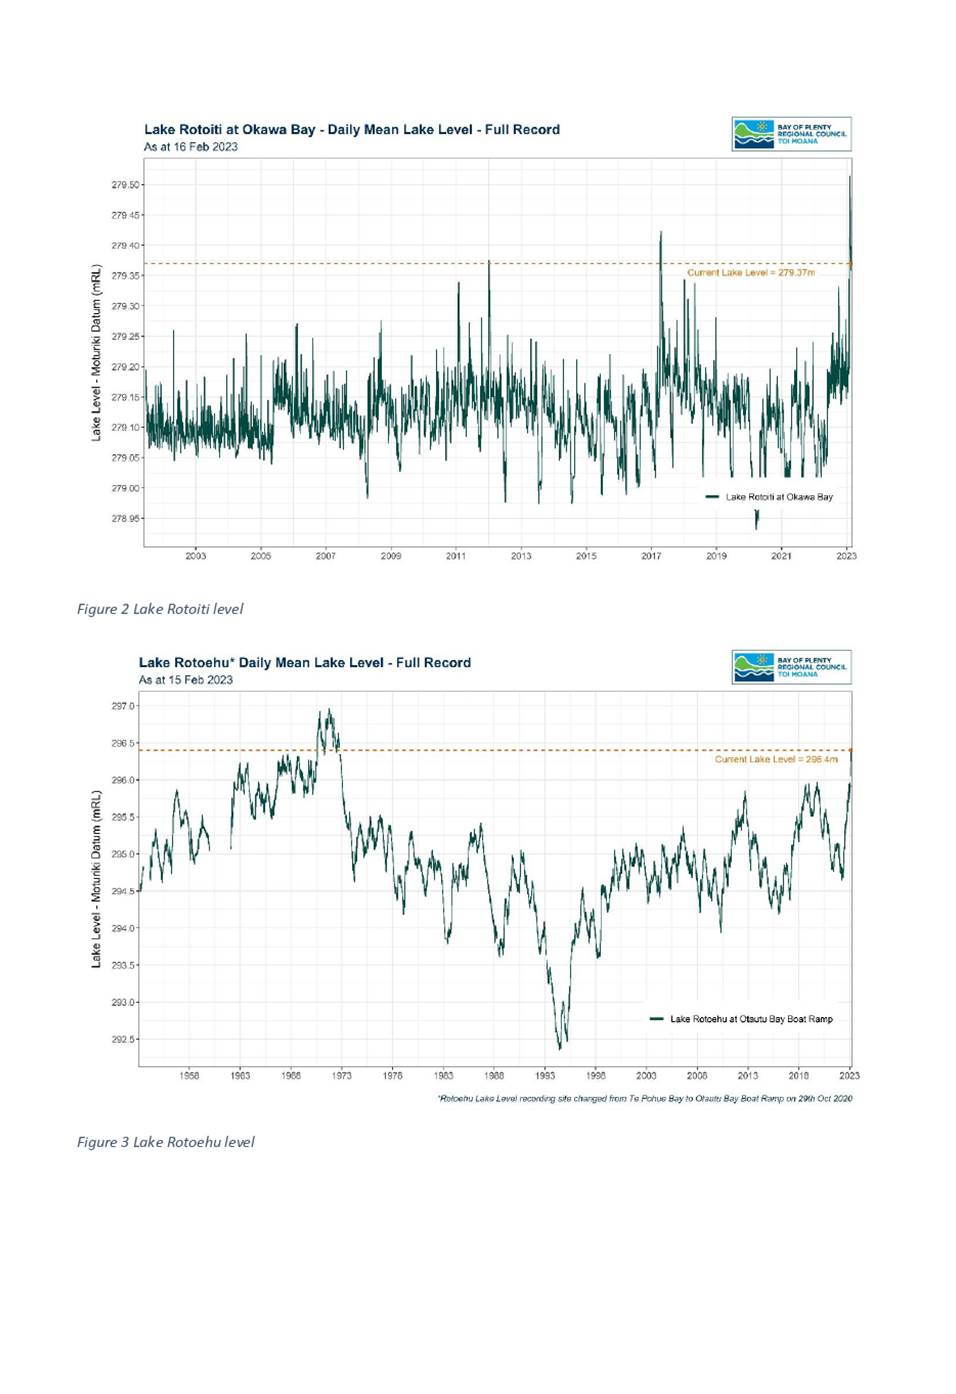
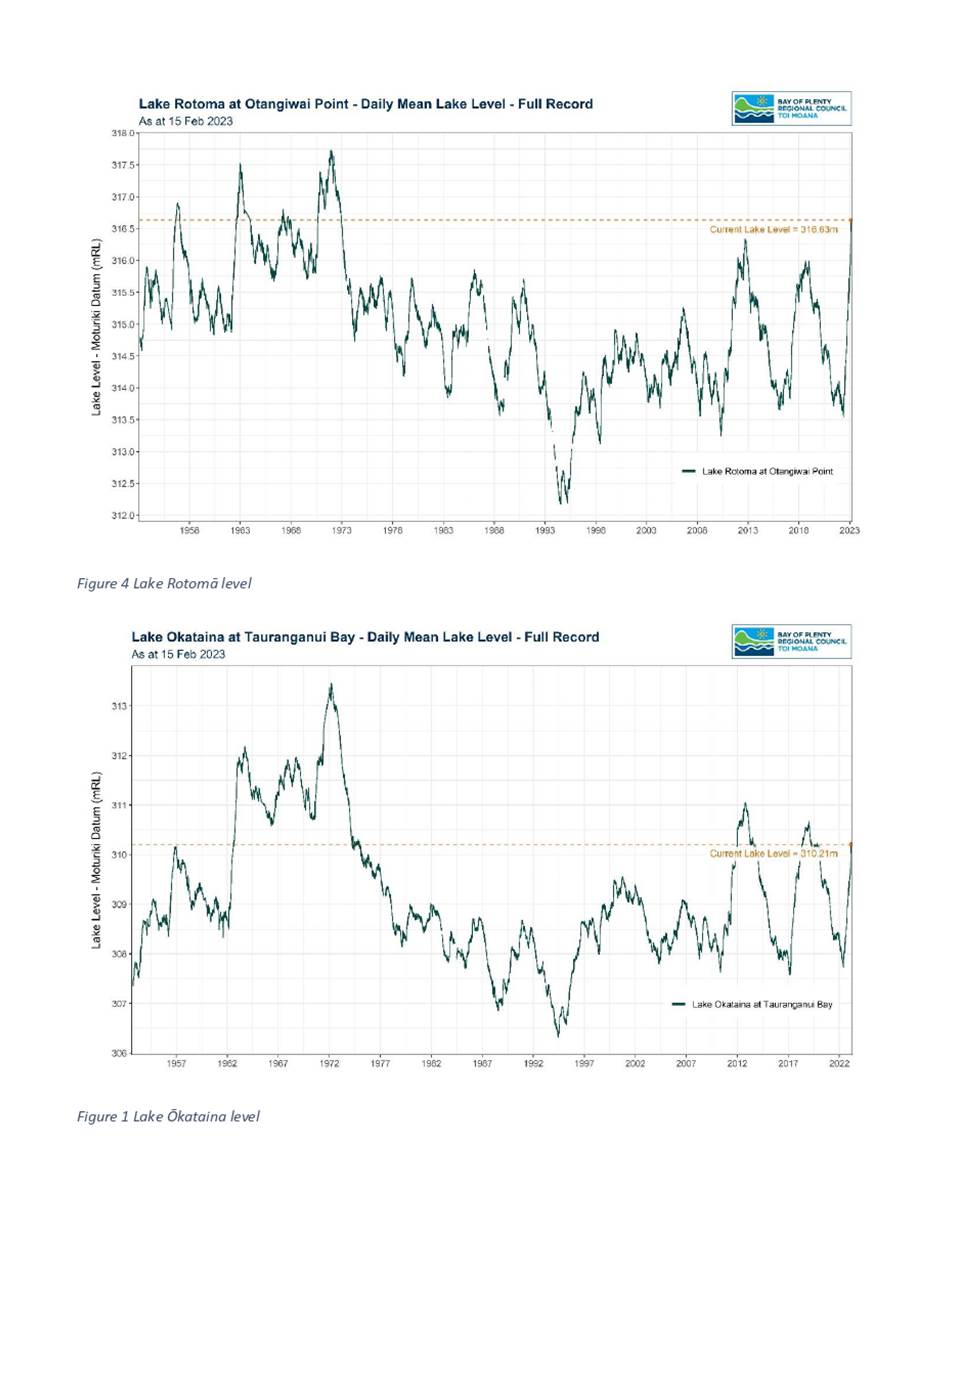
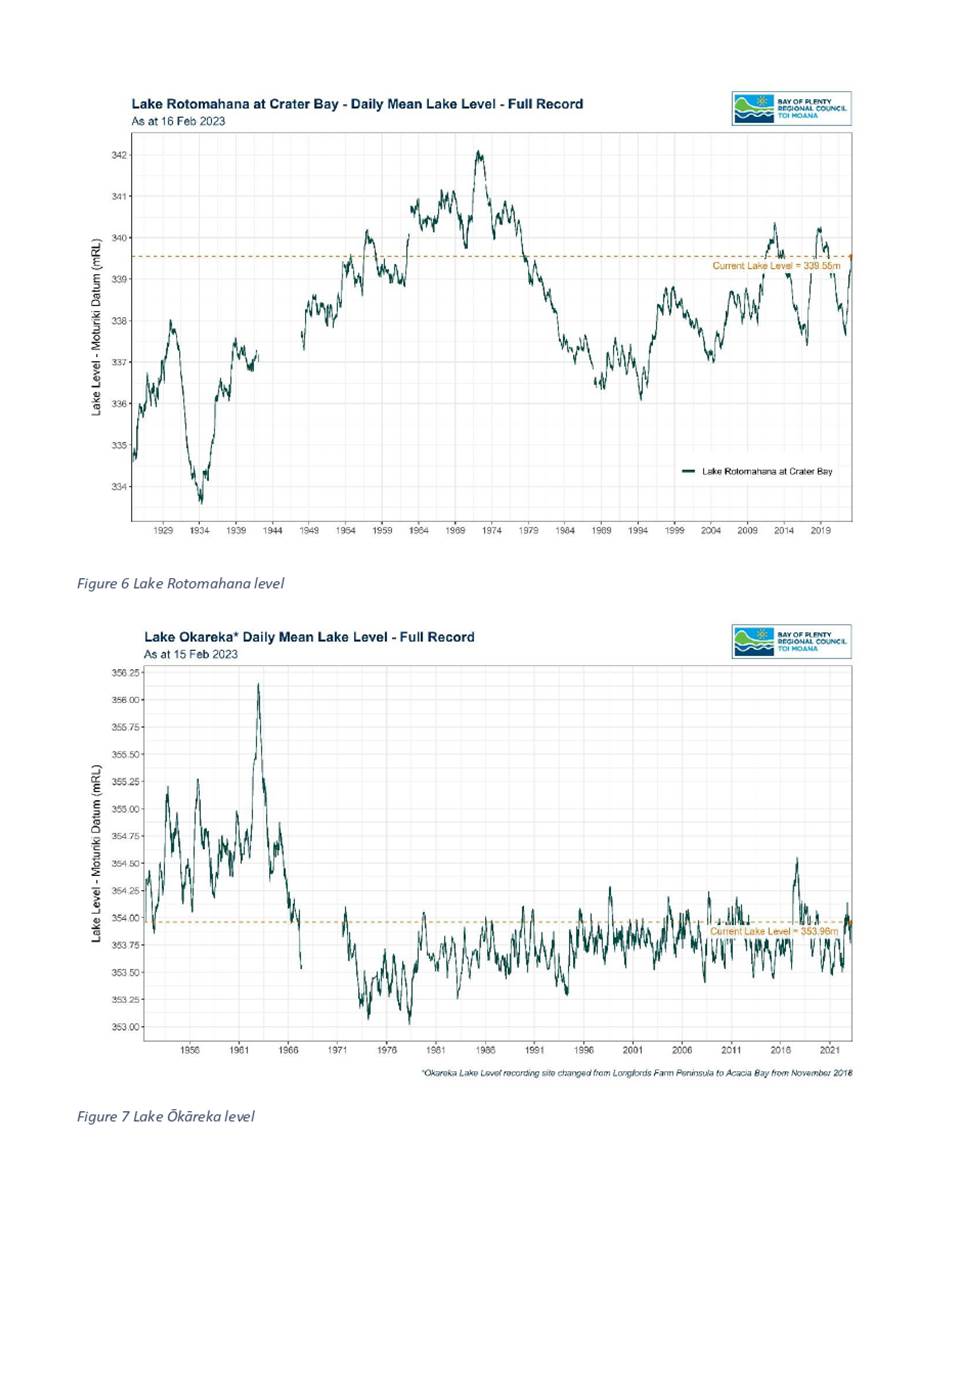
|
|
|
|
|
|
Report To:
|
Monitoring
and Operations Committee
|
|
Meeting
Date:
|
7 March
2023
|
|
Report
Writer:
|
Jackson Efford, Principal Advisor,
Land and Water
|
|
Report
Authoriser:
|
Chris
Ingle, General Manager, Integrated Catchments
|
|
Purpose:
|
To update Councillors on the Land
Management work programme around Tauranga Moana
|
|
|
|
Tauranga
Moana Land Management Operations Update
|
Executive Summary
This is a summary of Land Management operations within the
Tauranga Moana Freshwater Management Unit area. It includes an update on
progress within the harbour’s Focus Catchments of Waitao (Kaiate
Falls), Kopurererua, Te Mania and Uretara, as well as providing other
operational highlights over the past 12 months. Preliminary summer water
quality results are available for Kaiate Falls, suggesting that the targeted
Focus Catchment work is having a positive outcome on helping to reduce E.
coli levels at this high profile swimming area.
Similar Land Management updates will follow at subsequent
Monitoring and Operations Committee meetings, including for
Kaituna/Maketū Estuary, Waihī Estuary, and the eastern Bay of
Plenty Focus Catchments, along with separate updates on the Biodiversity and
Coast Care programmes.
|
Recommendations
That the Monitoring and Operations Committee:
1 Receives the report, Tauranga Moana Land Management
Operations Update .
1. Introduction
The Western Land Management team
delivers a diverse range of operational works around Tauranga Moana to improve
water quality and biodiversity, including the ‘Focus Catchments
Programme’ which aligns our work with the highest Essential Freshwater
programme priorities such as improving the swimmability of poorly performing
swimming sites. Previous Monitoring and Operations Committee
reports provide programme background and updates. This report provides an
update on the targeted work which continues in the priority Tauranga Moana
Focus Catchments of Waitao, Kopurererua, Te Mania, and Uretara.
We are now several years into
the programme and some of the smaller Focus Catchments have experienced a
slight decline in the rate of new land management works able to be achieved
voluntarily, using education/incentive-based approaches with willing landowners
- notwithstanding that a significant amount of work has been successfully
achieved with community in these areas to date. Additional Focus Catchment
support is now being extended to other priority areas within the harbour,
including the Wairoa Catchment and “Project Parore’s”
northern Tauranga harbour catchment group area. This work aligns closely with
the Council’s Essential Freshwater programme priorities for the Tauranga
Moana Freshwater Management Unit where a moderate (10-40%) level of change is
likely required to both sediment and E. coli, meaning our land
management activity and interventions are an important delivery tool for
achieving water-quality improvements.
1.1 Legislative Framework
The Land Management programme is
an education and incentives-based work programme. It both compliments and
aligns with the legislative requirements and priorities of the Essential
Freshwater Programme for Bay of Plenty, as well as other priorities such as
biodiversity and care group support.
1.2 Alignment with Strategic
Framework
|
A Healthy Environment
|
We work
cohesively with volunteers and others, to sustainably manage and improve our
natural resources.
|
|
Freshwater for Life
|
We
deliver solutions to local problems to improve water quality and manage quantity.
|
The Land Management programme aligns with a number
of community outcomes, including those related to Healthy Environments and
Freshwater for Life. Our Focus Catchments work is monitored in a number of
different ways, including the Council’s ‘Swimmability’ KPI
and through the Councils wider water quality monitoring programmes. Ultimately,
the Focus Catchment Programme becomes a key link between voluntary land
management action and the Council’s requirements to deliver the NPS-FM.
1.2.1 Community Well-beings Assessment
|
Dominant Well-Beings Affected
|
|
þ Environmental
High -
Positive
|
þ Cultural
Medium
- Positive
|
þ Social
Medium
- Positive
|
þ Economic
Low -
Positive
|
Focus Catchments work contributes directly to positive environmental
outcomes as its core purpose, with positive co-benefits around Cultural and
Social well-beings
2. Land management progress
2.1 Focus Catchments update
Work continues to be delivered
throughout the Kopurererua, Waitao, Uretara and Te Mania sub-catchments of
Tauranga Moana as part of the Focus Catchments programme, along with other
priority community projects around the rest of the harbour. The following
provides some highlights of completed and planned activities in each catchment,
including monitoring from Kaiate Falls. Overall, Tauranga Moana Land Management
activity is significant with over 100 active Environmental Programmes, 80 km of
protection fencing, and over 1 million native plants established in recent
years.
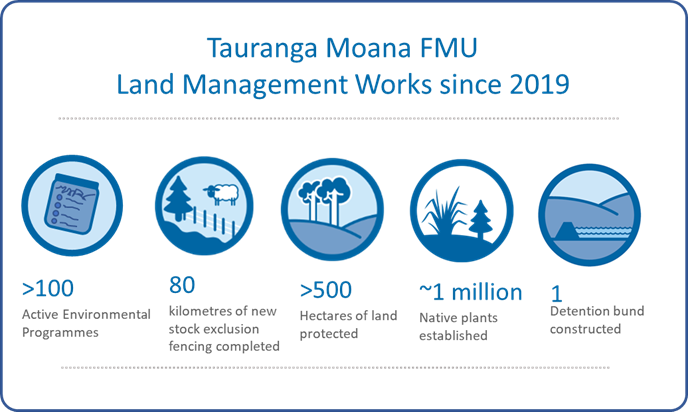
2.2 Kopurererua Catchment
Summary
The Kopurererua
catchment is 7,400ha in size and located to the Southwest of Tauranga City, it
flows north from the Mamaku Plateau foothills approximately 450 m above sea
level, through the western suburbs of Tauranga City and discharges into the
Waikareao Estuary in Tauranga Harbour. The total length of streams in the
catchment is approximately 150 km with the Kopurererua approximately 29 km
long. The catchment has two main tributaries, the Tautau and the Nanakau. The
Tautau is the largest tributary at 18 km long and is one of the two spring fed
awa supplying water for Tauranga City. The catchment receives 1968 mm of
rainfall on average per year.
The catchment
is dominated by three distinct geographical zones. The lower catchment is
dominated by the low-lying Kopurererua Valley Reserve floodplain and wetlands,
bordered by low-lying hills <100m asl. Urban and industrial development in
this area has led to increased stormwater runoff due to a reduction in
permeable areas. The mid catchment sees a significant gradient change from the
upper catchment and is characterised by meandering streams and wide alluvial
valleys bordered by steep hills and flat plateaus. The soil types and geology
make this area vulnerable to stream bank erosion and soil loss, especially
where intensive land use change has occurred.
The upper most
part of the catchment (above Taumata Road) on the Mamaku plateau foothills is
characterised by steep to rolling sheep and beef hill country, with a large
network of ephemeral flow paths that contribute high amounts of sediment and
nutrients into the Kopurererua and Tautau streams during high intensity
rainfall events. There are no perennial waterways in this part of the
catchment.
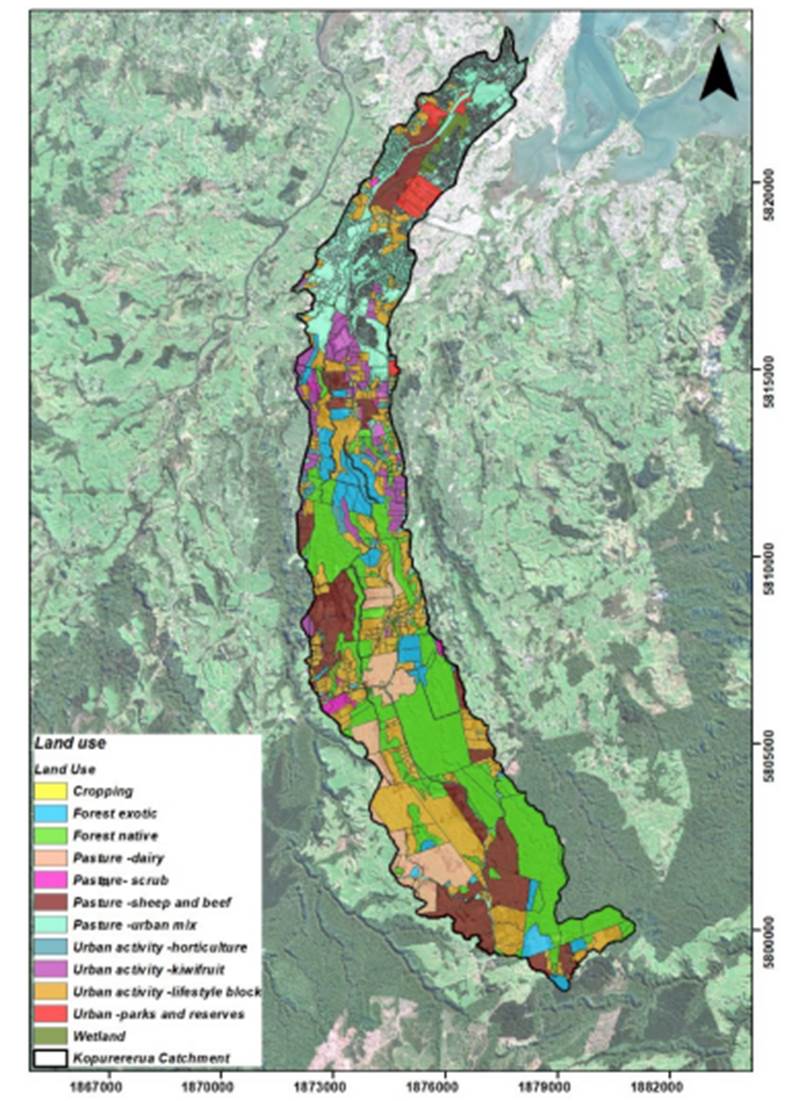
Current
landuse in the Kopurererua catchment.
The Kopurererua Catchment has an on-going
sediment and Escherichia coli (E.Coli) issue which impacts in-stream
values and the downstream receiving environment of Waikareao Estuary. The
bathing site (Canoe Slalom gates) at McCord Avenue in the lower Kopurererua
stream frequently exceeds safe levels for contact recreation.
The last 18
months have seen targeted approach with landowners, hapu, and community groups
throughout the catchment to develop Environmental Programmes that seek to
improve land management practices and water quality outcomes in the catchment.
This includes (completed and planned works) 7 km of new stock exclusion
fencing, 14 ha of land retirement, 2 detainment bunds, and over 290,000 native
plants in the ground (this includes planting as part of the Kopurererua
re-alignment project). In total, 100ha of land has been retired in the
catchment under existing and historical BOPRC programmes.
2.2.1 Kopurererua Environmental Programmes
There are
currently 11 active environmental programmes within the Kopurererua Focus
Catchment.
Given our
current understanding of water quality and contaminant sources in the
catchment, the upper catchment environmental programmes are targeted towards
sediment reduction activities such as retirement/planting of steep erosion
prone land, coupled with construction of detainment bunds to attenuate sediment
and phosphorus that is usually transported during high intensity rainfall
events.
However,
recent water quality monitoring also indicates elevated nitrogen concentrations
at Taumata Road bridge that is likely anthropogenic in nature. Working with
landowners in the upper catchment to undertake detailed farm planning and
systems analysis along with an improvement in some intensive winter grazing
practices will be a focus moving forward.
Environmental
programmes in the mid catchment are focussed on good management practice in
riparian zones, particularly as the gradient and geology in this area make it
prone to stream bank erosion. The mid catchment is also home to many floodplain
and hanging wetlands that hold good enhancement potential. A recent survey
identified 33 natural wetlands in the mid-catchment that were predominantly
palustrine marsh/sedgeland (Morphum, 2021). The vegetation condition of these
wetlands varies, with a number having grey willow infestations. There are 3 environmental
programmes in the mid-catchment that have a focus on willow control and native
revegetation in these wetlands.
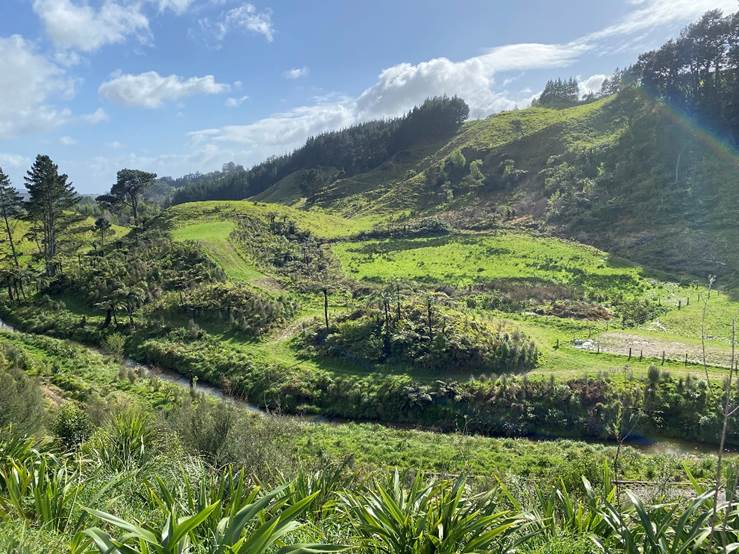
An example
of riparian retirement and planting in the mid Kopurererua catchment.
The lower
catchment has one environmental programme in partnership with Tauranga City
Council (TCC) and Ngāi Tamarawaho. Motuopae Island is an Urupa for
Ngā Tamarawaho hapū and their ancestors. It is a BOPRC priority
biodiversity site, and this environmental programme has a focus on pest control
and re-vegetation with a large amount of in-kind contribution and volunteer
hours being undertaken by the hapū.
2.2.2 Kopurererua Detainment bunds
The large
network of ephemeral flow paths in the upper catchment contributes increased
amounts of surface runoff into the Kopurererua and Tautau streams during high
intensity rainfall events. This surface runoff is often laden with sediment and
nutrients which negatively impacts water quality and ecological values. This part
of the catchment is well suited to the construction of detainment bunds due to
its favourable contour, network of ephemeral flow paths, and propensity for
high intensity rainfall events.
A detainment
bund is a low earth berm placed across and ephemeral flow path and is designed
to temporarily detain stormwater run-off to improve water quality outcomes, the
ponding duration is temporary (up to 72 hrs to ensure no compromise in pasture)
with an upstand riser and plug allowing for sediment and nutrients contained in
the ponded water to settle out into pasture during this time. Detainment bunds
are generally located on valuable and productive pasture, as these gentle
contour areas generally make suitable ponding areas. They form a seamless
integration into the landscape that do not require large areas of to land to be
retired to improve water quality outcomes. Several detainment bunds have been
constructed in the Lake Rotorua catchment to assist with improving water
quality outcomes, and recent PhD research completed on these structures
indicates that detainment bunds retain 47-68% of phosphorus and 51-59% of
suspended sediment (Levine, 2020).
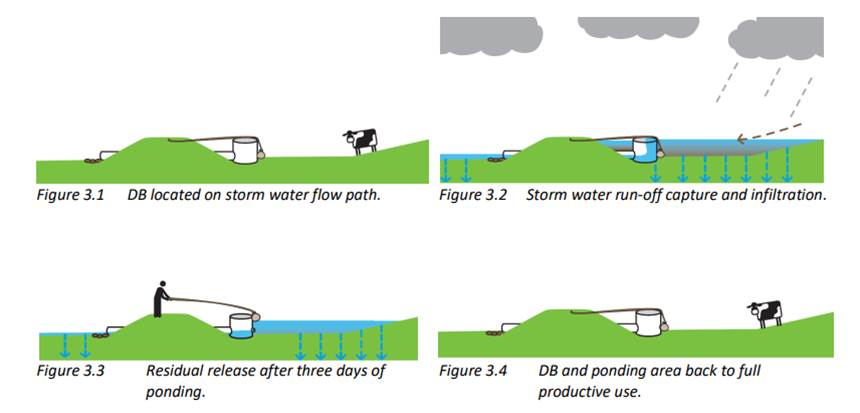
The
sequence of detainment bund ponding and releasing during a storm event.
Early 2022 saw
the construction of the first detainment bund for the upper Kopurererua
catchment. This site is intended to be used as a demonstration site to promote
wider uptake in the Tauranga Harbour Catchment. The design and construction for
a second detainment bund on a neighbouring property is planned for completion
in 2023.
There has been
some recent work completed in the mid and upper catchment to scope further
suitable sites for detainment bunds that meet optimum storage ratios under
BOPRC Detainment Bund Guidelines. This study indicated that there are
approximately 36 feasible sites in the upper catchment, and 11 in the mid
catchment. Staff will be working with landowners of these identified sites in
the coming 12 months to gauge interest in any further construction of
detainment bunds.
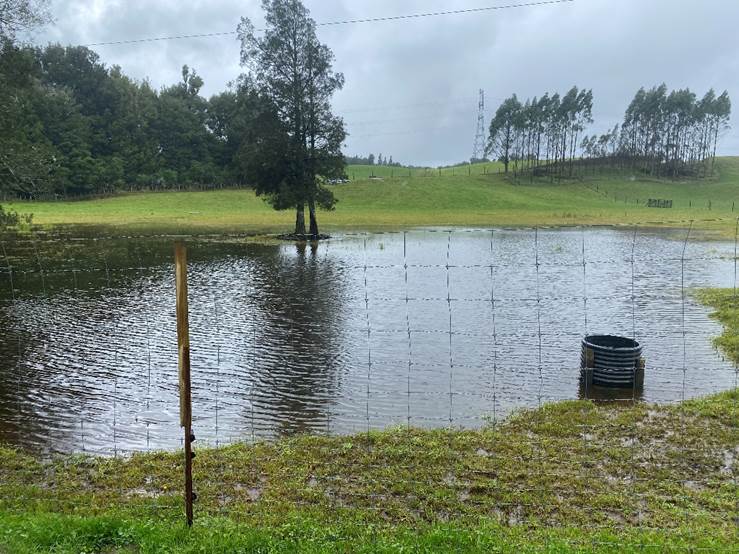
The recent
weather event in late January 2023 saw this detainment bund ponding and working
as designed.
2.2.3 Koromiko wetland fish habitat project
(Kopurererua)
BOPRC are
partnering with TCC and Ngāi Tamarawaho, along with funding partners,
Ngā Matarae Trust/Port of Tauranga to enhance fish passage and habitat in
the Koromiko wetland in Judea.
The flood
impact modelling and concept design has now been completed. The project
steering group will convene in early March to approve one of three concept
design options, before progression to detailed design and construction in late
2023.
2.2.4 Kopurererua re-alignment
Restoration of
the Kopurererua Valley has been planned and undertaken at various times over
the past 15 years. Historically the lower reaches of the Kopurererua stream
have been straightened, cleared and drained for pastoral farming. These
activities have negatively impacted on water quality and habitat in the area as
well as reducing the flood capacity in the catchment. The re-alignment project
is a partnership between TCC, BOPRC and Ngāi Tamarawaho and is split in to
two parts, Northern and Southern. The purpose of the project is to restore the
Kopurererua stream to a more natural path which will increase in-stream
habitat, reduce velocities, increase sediment deposition (via submerged benches
and sedimentation wetlands) and allow for floodplain engagement during high
flows. Several logs and in-stream woody features will be placed in the channels
and will assist with creating diversity and habitat for native fish, along with
two new bridges and associated pathways to enhance accessibility for
pedestrians and cyclists. The existing channels are to be de-fished and
backfilled to surrounding ground level upon completion of the re-alignment.
The proposed
alignment has been selected based on matching the historic sinuosity and
alignment (where possible) and avoidance of site constraints, including the
Nanako Stream confluence, topographical features, gas and power/transmission
lines and cycleway and access roads. The proposed alignment also retains
existing maintenance access for utility owners.
The
re-alignment project commenced in January 2022 and is due for completion in
2024. A total of 270,000 native plants will be planted over the course of the
project. The project and all procurement is being led by TCC with support from
Ngāi Tamarawaho and BOPRC. The total project value is over $4,000,000 with
$1,268,000 in funding from BOPRC.
Southern
re-alignment
Earthworks for
the southern part of the re-alignment are nearing completion. The excavation of
the new channel was completed in April 2022 with the banks and submerged bench
planted in winter 2022 (38,832 plants). Construction of the sedimentation
wetland is well underway and due to be completed in March 2023. A further
187,736 plants are due to be planted in the floodplain and sedimentation
wetland in winter 2023.
The new channel
is currently blocked by an up-stream and down-steam ‘plug’, the
excavation of these plugs and the subsequent de-fishing and backfilling of the
existing channel is planned to occur in mid-February (weather permitting). Upon
completion of this, the new southern re-alignment will be ‘live’.
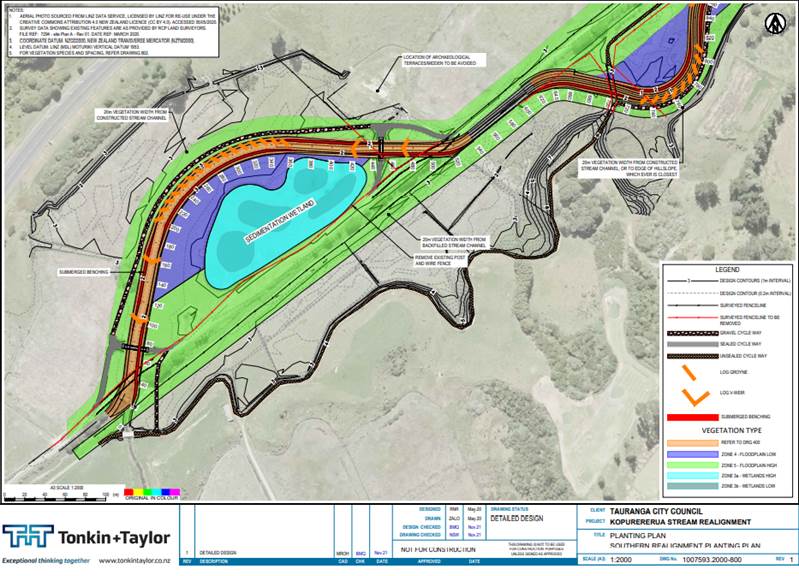
Southern
re-alignment detailed design.
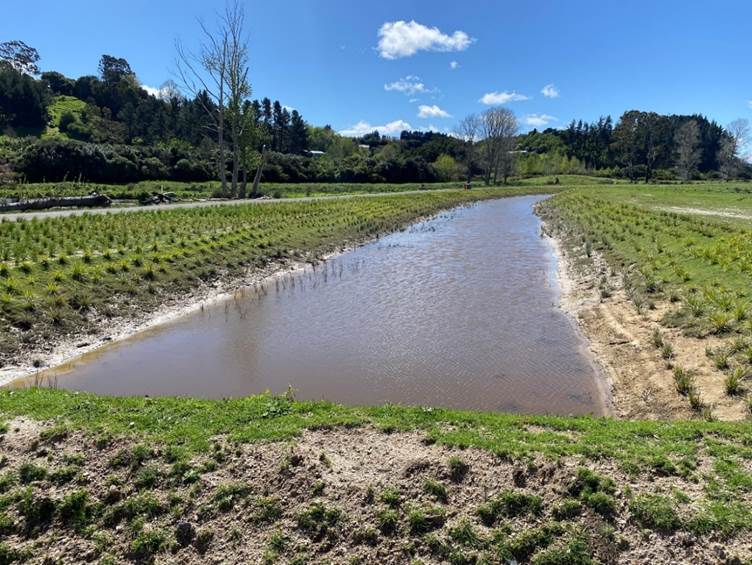
The new
southern re-alignment channel.
Northern re-alignment progress
The excavation
of northern re-alignment channel was completed in December 2022. In-stream
features such a log groyne, and v-log weirs are planned to be installed in
March/April 2023, prior to the close of earthworks season. Winter 2023 will see
31,720 native plants planted along the banks of the new channel. The
‘livening’ of the northern re-alignment channel, including the
excavation of the upstream and downstream plugs will occur in the summer of
2024. A small amount of in-fill planting will be completed in 2024.
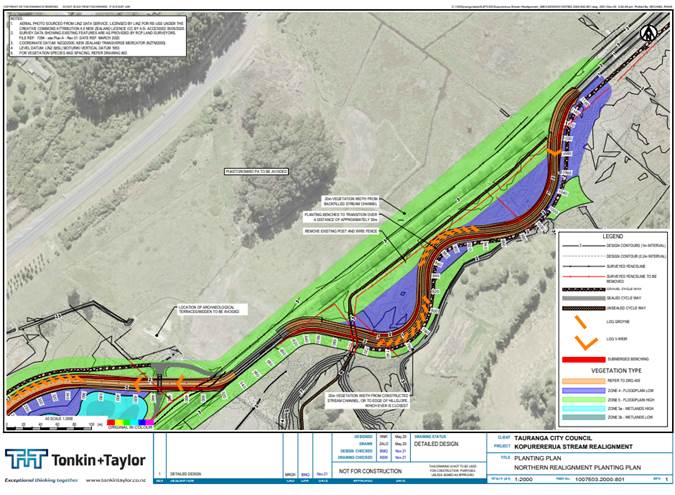
Northern
re-alignment detailed design.
2.2.5 Fish passage remediation in the
Nanakau Stream (Kopurererua)
As part of a
catchment wide waterway assessment for the Kopurererua in 2021, several
in-stream structures were assessed for their capacity to enable effective fish
passage. A total of 54 structures were identified as posing a barrier to fish,
with 77% being artificial such as perched culverts or pipes. A large portion of
these barriers are in the Nanakau tributary in the lower urban catchment, and
are located on a mix of public and private property. A local specialist has
been engaged to undertake small scale remediations to those identified barriers
throughout the Nanakau Stream tributary. The fieldwork and reporting for this
project is nearing completion.
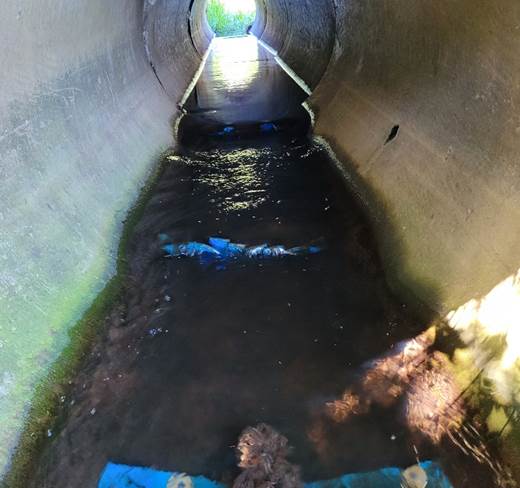
This
structure has had 450mm flexi-baffles installed to create complex flow allowing
for rest pools and increased depth of water, reducing energy demand for
migrating species.
2.2.6 Priority Kopurererua actions for
2023/2024
1. Utilising
the detainment bund scoping work for the mid and upper catchment, including
engagement with landowners that have suitable sites and progress through to
design and construction where appropriate.
2. In
collaboration with industry, work with individual landowners above Taumata Road
to identify critical source areas, intensive winter grazing, and opportunities
improve to farm system practices.
3. BOPRC
to continue an active role in supporting the development and construction of
the Kopurererua re-alignment to enhance biodiversity and increase sediment
deposition.
4. Continue to work with individual landowners to develop
Environmental Programmes that contribute to enhanced biodiversity and water
quality outcomes in the catchment.
2.3 Waitao
(including Kaiate Falls) Focus Catchment
Since
2020, significant resource has been committed to the Waitao catchment and in
particular the Kaiate Falls catchment, due to ongoing swimmability issues due
to bacterial contamination. A mixture of support has come from Regional
Council, local land care group, crowd funding, central government funding and
landowners. Significant livestock exclusion fences have been built with
impressive buffer zones and setbacks. At least 59,079 native plants have been
planted directly above the falls during this time with 21.4 ha of land retired
and over 10 km of new fencing built. The wider Waitao catchment has also had
significant retirement, fencing and planting. Alternative stock water has been
made available where required.
Engagement with landowners in
the wider Waitao catchment is continuing in accordance with our internal
prioritisation list. A number of projects are either planned or underway.
Recent weather events have caused significant damage throughout the catchment,
including damaged fences, slips, stream bank erosion and stream blockages
Planning is underway to support and rectify damage where possible.
Summer water quality monitoring
in the sub-catchment at and above Kaiate Falls is well underway, and the
results appear to show reduced E.coli levels compared to usual, which is
very encouraging and indicates the likely effectiveness of this highly targeted
work to address water quality (as seen in Table 1 below).
Scientific and statistical
analysis will be completed once all summer monitoring has been completed later
in March, and consider factors such as waterway flow data, land management
change and rainfall.
Summer
water quality monitoring this summer vs last summer at Kaiate Falls below,
showing that the E. coli situation appears to have improved following land
management interventions 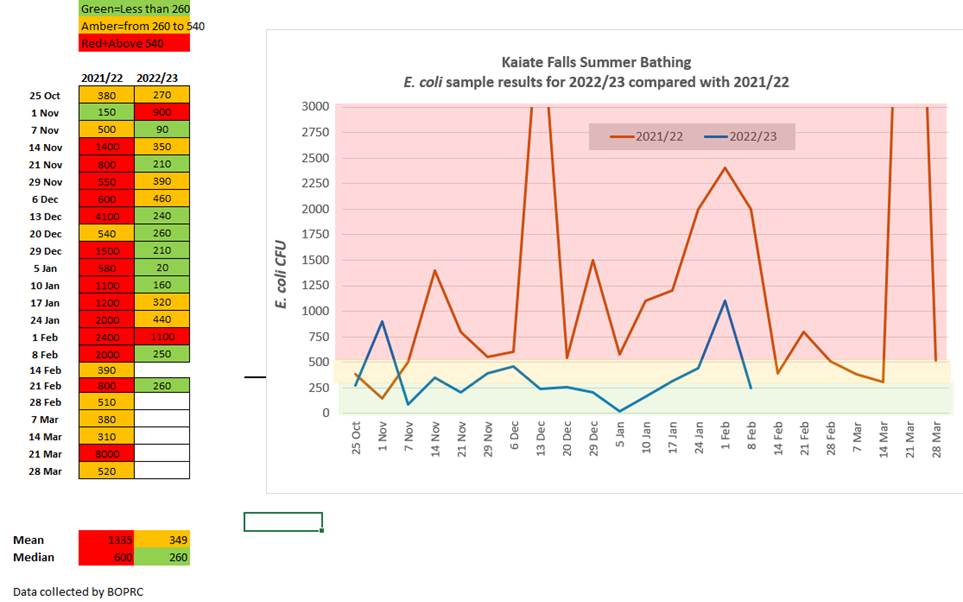
.
Kaiate
Falls Catchment looking up two of the gullies toward the Ōtawa trig
carpark during planting 2020. Note the amount of water sitting in the
wetland/gully area
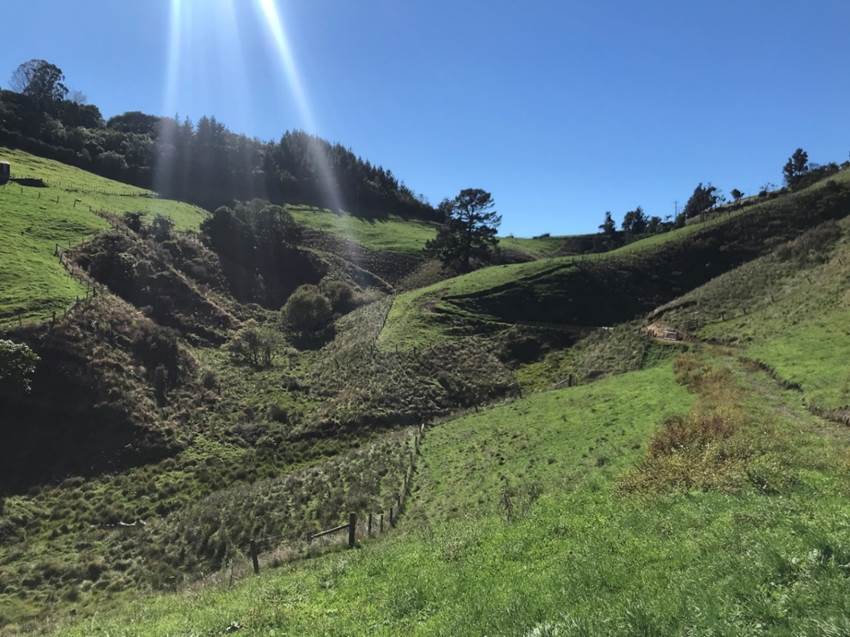
Similar
photo point as above taken spring 2021 post releasing, natives establishing
well.
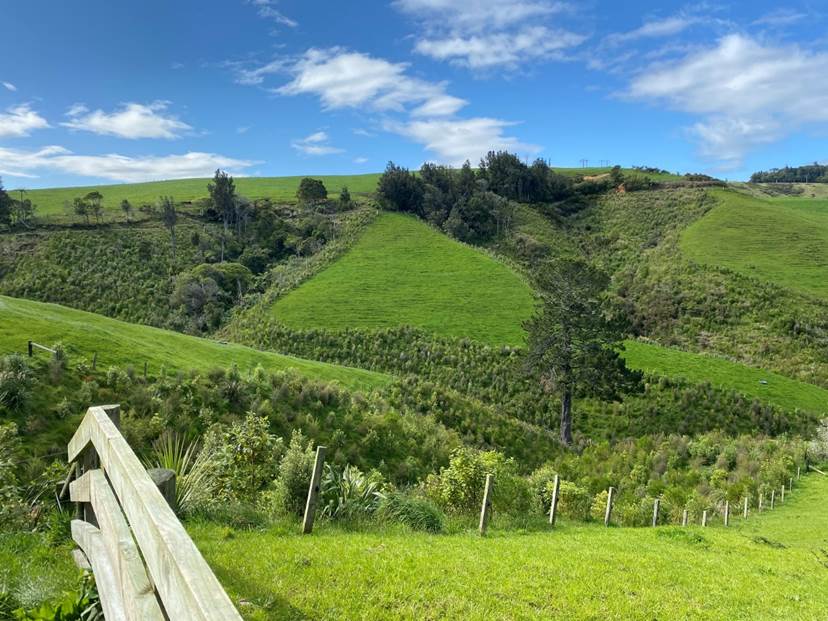
Different
angle, same plantings in summer 2023. Very few losses have been identified and
plants are thriving.
2.4 Uretara Focus Catchment
There are currently five active
Environmental Programmes in the Uretara catchment at various stages in their
five-year programmes. One of these is newly signed this year. Three
are principally wetland restoration projects, one extensive steep land and
riparian retirement and the other riparian retirement.
The relationship with Project Parore
continues to strengthen with active partnership both financially and in terms
of implementation. Their works crew has been integral with planting and pest
plant activities in many of the programmes. Significant work is underway around
planning new collaborative projects with private landowners and the three
northern hapū of Tauranga Moana.
The following is a summary of
some highlights from the past year.
Lindemann Road EP –
this property is a 51 hectare, steep dry stock property adjacent the Kaimai Forest
Park. Over the past 12 months approximately 4km of fencing has been
constructed to protect a total of 28ha (21.5ha native forest and 6.5ha of steep
gullies and watercourses). Major pest plant control has been undertaken in
preparation for the planting of 16,000 native plants this coming winter in the
steep gullies.
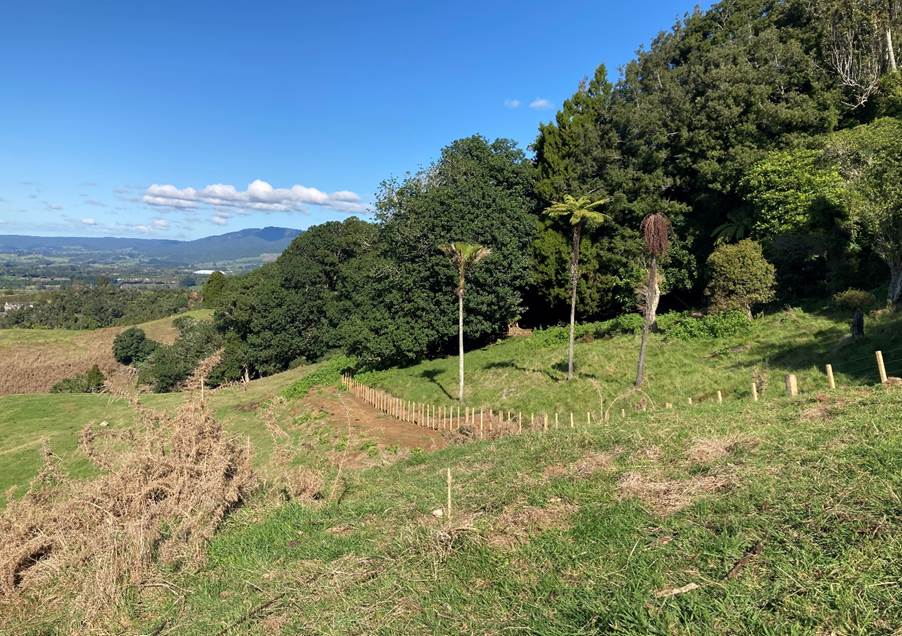
Lindemann
Rd Property looking along fence line that removes stock from 22ha of native
forest contiguous with the Kaimai Forest Park
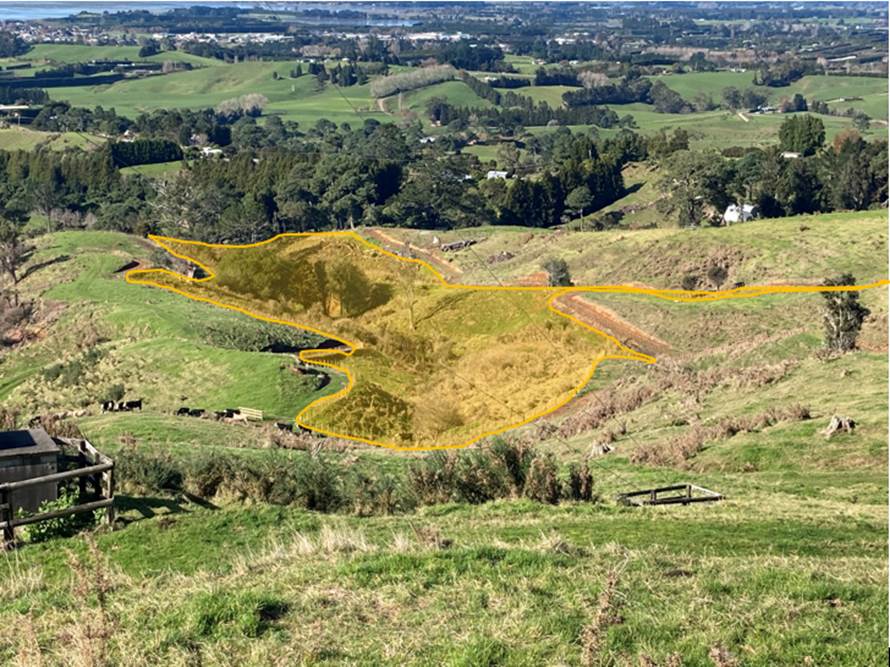
Lindemann
Rd property looking down on one of two large steep gullies. They are
newly fenced and note the extensive dead gorse and privet done in preparation
for planting winter 2023.
Henry Road Wetland –
on this property a previously drained wetland was reinstated by blocking up the
drain. The wetland and margins were fenced and planted. This
wetland provides biodiversity habitat and filters surface and ground water from
a contributing catchment of intensive grazing land.
Uretara Dairy Farm –
this farm is the single largest farming enterprise in the Uretara
catchment. This dairy property has recently changed hands and Regional
Council is working with the owner and Tipu Whenua consultants on a farm
planning exercise to look at the risks and opportunities for environmental
retirement and mitigation works.
Inanga spawning habitat
– the development of a new EP to restore inanga spawning habitat along
the tidal reaches of the Uretara River is currently in progress. This is
collaborative project between Western Bay of Plenty District Council, Ngāi
Tamawhariua, Project Parore & Regional Council. It is expected that
any physical works will be undertaken next spring after the upcoming spawning
period but pest plant control and planting will commence shortly.
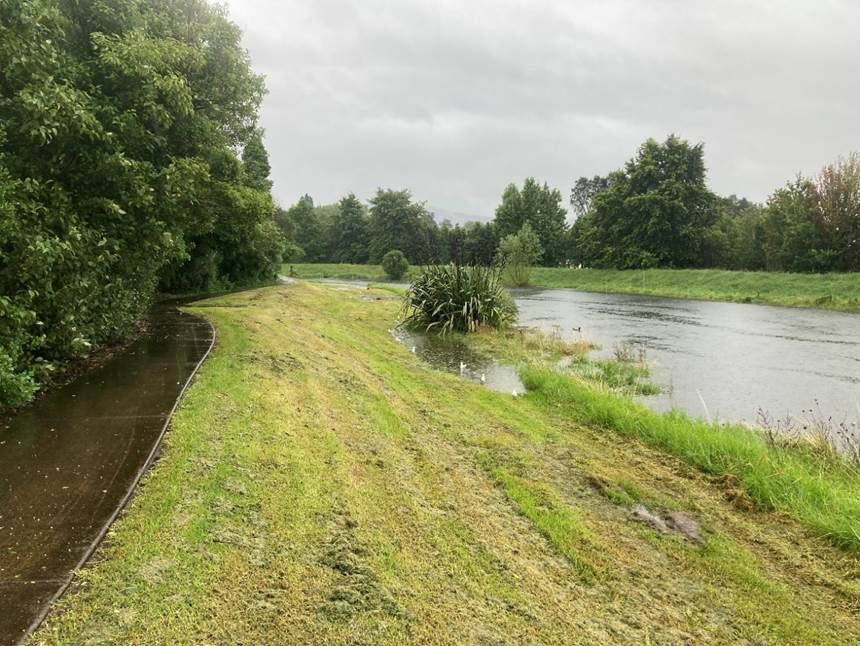
Uretara
Riverbank below SH2. Photo taken the hightide the day before cyclone
Gabrielle so the visible water level is slightly higher than typical spring
tides. The flooded portions of the riverbank will be enhanced as spawning
sites for inanga by shallow excavations and extensive planting.
Upper Busby Rd community
– in collaboration with Project Parore we are currently exploring a
landscape scale biodiversity restoration and management plan with the
community. At the top of Busby Rd there is a community of approximately
15 lifestyle blocks adjacent the Kaimai Forest Park. The landscape is
extremely steep with ecologically significant remnants of scattered
forest. Many in the community are keen to instigate a network of pest
animal control and create corridors of native forest linking the remnants.
Individually the properties are relatively small but collectively significant.
2.5 Te Mania Focus Catchment
There are currently 11 active
Environmental Programmes at various stages in the Te Mania catchment.
Most of these are in the maintenance stages with the exception of 3500 native
plants planted last winter, the last of a 5 hectare steep land retirement
programme.
A considerable amount of works
has been completed over the past four years. The maintenance phase is a
crucial one in the relative success of any retirement project. Pest plant
control is the main activity to allow native plantings to thrive.
There are two newly signed
programmes this year which will see 3.5 ha of steep land retired later this
summer and 9,500 native plants planted this coming winter.
2.6 Care Group Programme
celebration events
A series of events were held
solely for volunteers in the months of October/ November 2022 as a thankyou for
all the wonderful work our volunteers do across the BOP rohe. These events were
hosted by the “Flaxroots Forum” which is a collective of
organisations and agencies who support environmental groups (Bay of Plenty
Regional Council, Tauranga City Council, Western Bay of Plenty District
Council, Bay Conservation Alliance, Envirohub and the Department of
Conservation).
Each event would provide a
chance for our volunteers to network amongst each other, showcase their own
work, share ideas and learn from one another. Four Open days were selected. Johnson Reserve (an urban
pest plant control focussed care group – TCC), Friends of the Blade (a
pest animal control group in the Kamai Mamaku Forest- DOC), Western Bay
Wildlife Trust (a species focussed group in an urban area – TCC &
DOC) and MOWS (a group with a wide range of activities working in a coastal and
wetland environment- WBOPDC & DOC).
BOPRC also designed certificates
that were signed by the Flax Roots group. These were then framed &
presented to the host group with a $200 grocery voucher as Koha.
Each of the Events were
completely different from small to larger gatherings. All volunteers mingled
and morning tea networking was successful. A wide range of Volunteer groups
were represented throughout the Western region with a range of age groups and
demographics. Some very positive feedback was received, with groups arranging
amongst themselves to visit other volunteer groups and the
comment made “that if this event takes place next year, we would be
strongly encouraging more members to come along”.
2.7 Mangrove management
2.7.1 Seedling control work
There are 9
active estuary care groups in Tauranga Moana area involved with mangrove
seedling works. Volunteers in groups continue to remove seedlings annually in
feasible areas within their rohe through working bees and lone work. Volunteers
have cleared/kept clear around 238ha between 1 Jan 2022 and 1 Jan 2023.
BOPRC
Contractors are utilised for seedling control in areas that are higher-risk to
volunteers (deeper sediment) or where groups are not active. Contractors
cleared 75ha between 1 Jan 2022 to 1 Jan 2023 costing around $88,650.00. Petrol
or electric scrub bars are the preferred tool.
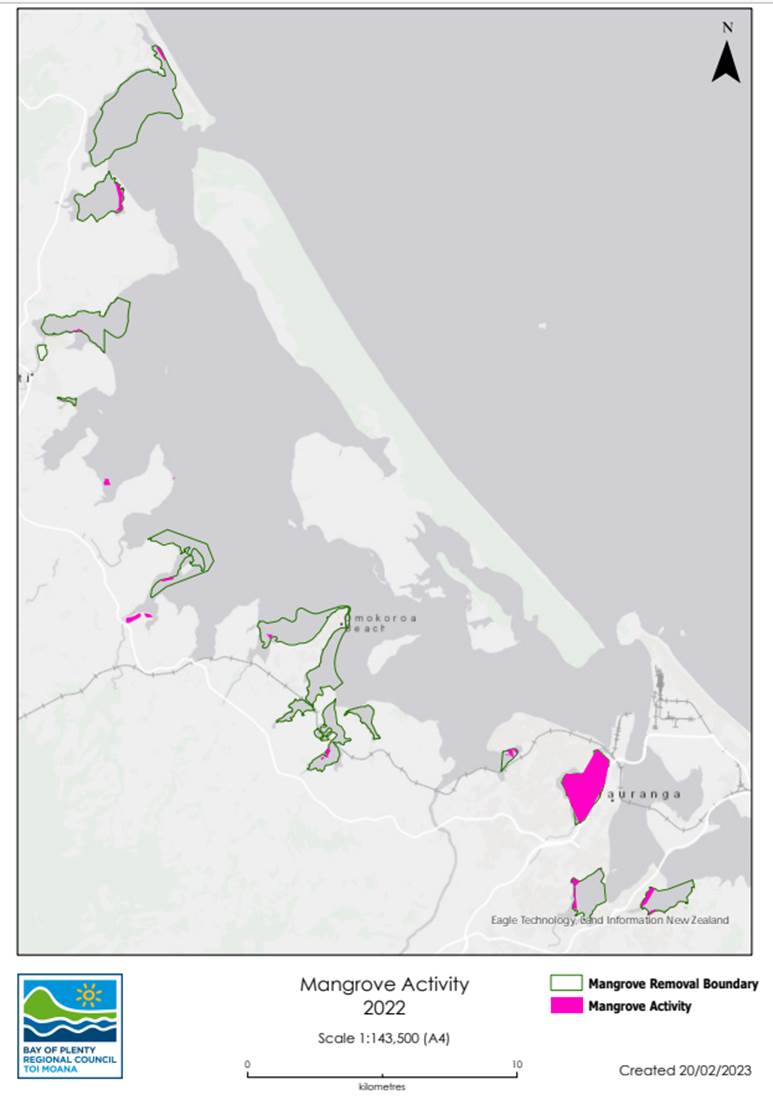
2.8 Sea Lettuce Clean-Ups
In previous years the regional
council and Tauranga City Council (TCC) have invested in beach-cast sea lettuce
clean-ups around popular public areas such as Kulim Park in Matua, keeping
these areas free of nuisance lettuce for recreation activities. This work is
completed together with TCC under a Memorandum of Understanding where we fund
50% of costs. In previous years the tonnage of sea lettuce collected has
ranged around 200-1,000 tonnes, but no collections have been required this
year.
Sea lettuce growth dynamics can
be cyclic, but the lack of sea lettuce this year could be attributed to the La
Nina weather pattern and unusually warm water temperatures (temperatures above
the optimum for sea lettuce growth). Previous sea lettuce blooms are often
associated with El Nino weather patterns. Our Land Management works to address
sediment and nutrient run-off into Tauranga Moana may also help to reduce the
occurrence of sea lettuce blooms.
3. Considerations
3.1 Risks and Mitigations
There are no significant risks
to this work programme at this time.
3.2 Climate Change
|
Mitigation
|
Adaptation
|
|
Reduce GHG emissions
|
Produce GHG emissions
|
Sequester carbon
|
Anticipate climate change impacts
|
Respond to climate change impacts
|
|
☐
|
☐
|
☒
|
☐
|
☐
|
Planting and land retirement activities can help to
sequester carbon and produce buffers for climate change.
3.3 Implications for Māori
Catchment
work spans the rohe of a number of different iwi/hapū. Consideration has
been given to the aspirations of iwi/hapu in the work programmes of each focus
catchment, with strengthening partnerships in various stages of engagement and
development.
3.4 Community Engagement
|

|
INVOLVE
Whakaura
|
To work directly with affected communities throughout
the process to ensure that their issues and concerns are consistently
understood and fully considered in Council’s decision making.
|
The Focus Catchment Programme
approach relies strongly on collaborative, voluntary work with landowners and
community to achieve water quality objectives
3.5 Financial Implications
This work fits
within the allocated budget for the programme. Demand remains high for
incentivised land management work and new Government funding such as the Hill
Country Erosion Fund will continue to increase the scale and quality of
on-the-ground actions possible.
4. Next Steps
The Land Management team will continue to deliver its
work programme across Tauranga Moana with community. Re-prioritisation of Focus
Catchments will occur as further Essential Freshwater Policy Programme
priorities become available and water quality data is
received.