|
|
|
|
|
|
Report To:
|
Risk
and Assurance Committee
|
|
Meeting
Date:
|
21
October 2021
|
|
Report
Writer:
|
Debbie Hyland, Finance &
Transport Operations Manager; Zhivan Alach, Organisational Performance
Manager; Tobias Fransson, Performance Analyst and Andy Dixon, Treasury &
Tax Specialist
|
|
Report
Authoriser:
|
Mat
Taylor, General Manager, Corporate
|
|
Purpose:
|
Review of the 2020/21 Annual Report
and presentation by Audit NZ
|
|
|
|
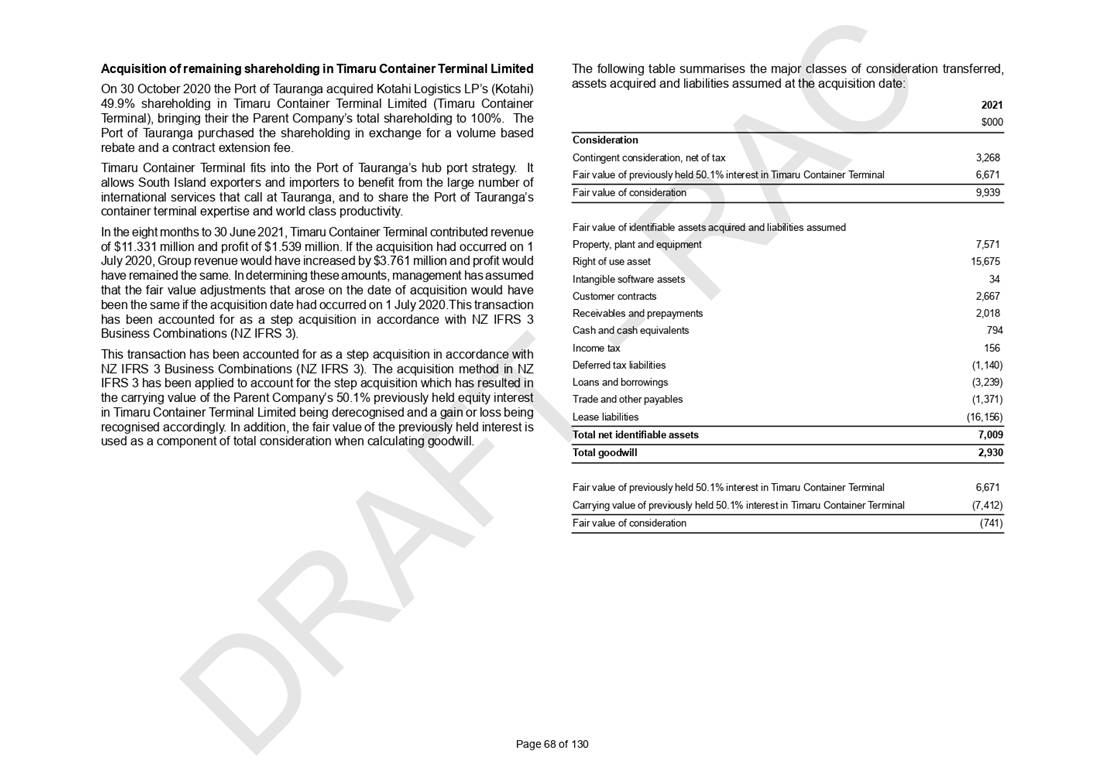
2020/21 Draft Annual Report review
|
Executive Summary
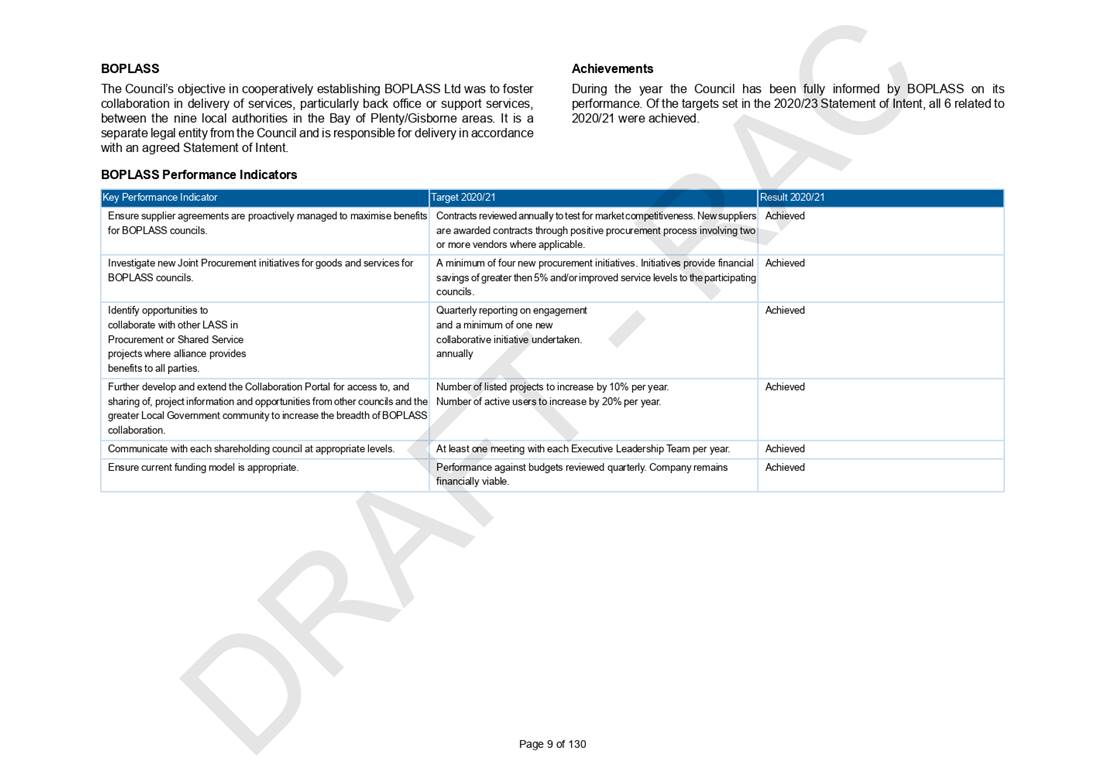
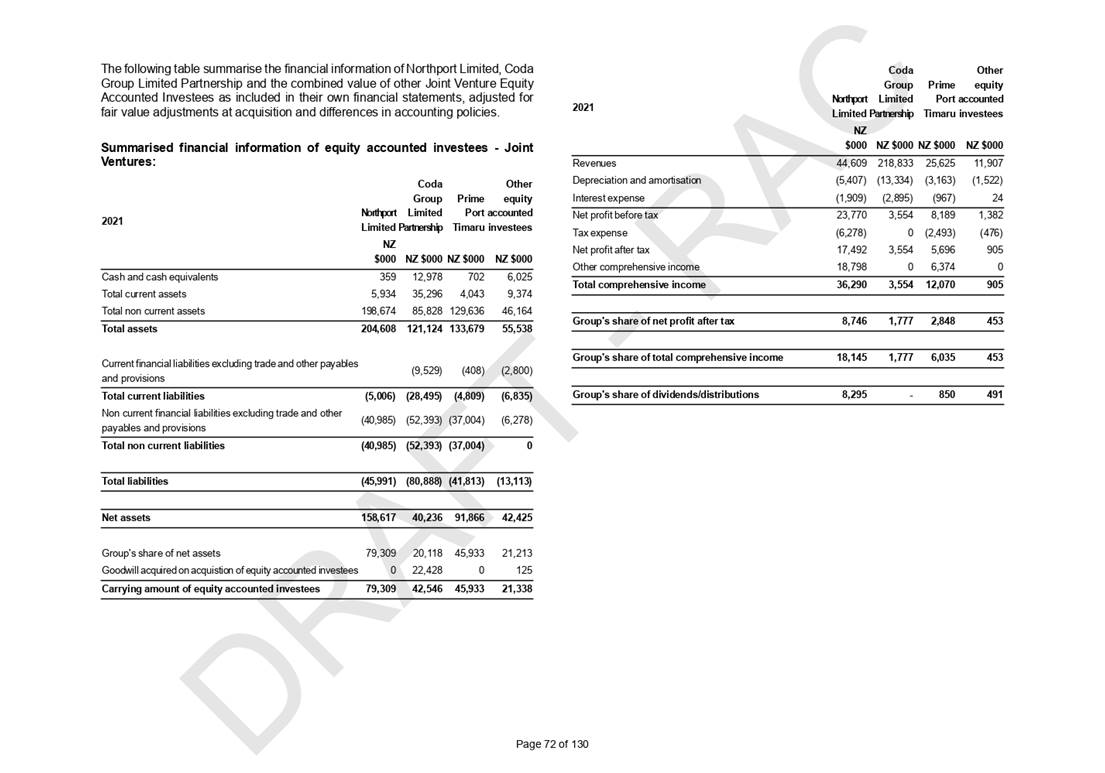
This report presents the Draft
Annual Report 2020/21 for the Bay of Plenty Regional Council to the Risk and
Assurance Committee. These reports contain the draft financial and
non-financial performance results of the Council for the year ended 30 June
2021 and consolidated financial statements for the Council Group which
includes our 100 percent Council-owned subsidiary, Quayside Holdings and
majority owned Council-owned subsidiary, Toi Moana Trust.
Council’s Long Term Plan
2018-2028 includes 33 performance measures with targets for 2020/21. We
achieved 28 (85%) of the targets that were set for the year ended 30 June
2021. The main reasons for financial and non-financial variations are
outlined in sections 2.1 and 2.2 of this report. This external audit of the
Council for the year ended 30 June 2021 is currently in progress. Staff
anticipate that Council will receive verbal audit clearance from Audit New
Zealand on 3 November 2021. The final 2020/21 Annual Report will be presented
for adoption by Council on 10 November 2021.
Council’s draft
operating surplus for year three of the Long Term Plan 2018-2028 is
$5.5 million which is $11.1 million higher than the budgeted deficit
of $5.6 million. Council delivered its work programme through operating
expenditure of $141.3 million (2020: $138.5 million) compared to a budget of
$142.4 million; this is $1.1 million lower than budget. Total revenue
is $146.8 million, this is $10.0 million higher than budget of $136.8
million (2020: $138.5 million). Council delivered a significant capital works
programme with expenditure of $27.6 million (2020: $36.4 million) compared to
a budget of $51.5 million; this is $24 million lower than budget
partly due to the impacts of Covid-19.
Staff have prepared a set of
draft consolidated accounts for the Council Group for review by Audit New
Zealand. The Draft Annual Report for the Council Group includes a record net
profit after tax attributed to Council of $85.5 million. The dividend pay-out
from Quayside to Council of $33.1 million is the largest to date, which has
helped to reduce general rates in 2020/21 by an average of $289 per property
in the region. Toi Moana Trust also paid a dividend to Council of $2.25
million in 2020/21 in line with its Statement of Intent. Council received the
audited Annual Report 2020/21 for Quayside and its subsidiaries on 30
September 2021.
Leon Pieterse, Audit NZ
Director and Anton Labuschagne, Audit NZ Manager will attend the Risk and
Assurance Meeting to discuss the audit process.
|
Recommendations
That the Risk and Assurance Committee:
1 Receives
the report, 2020/21 Draft Annual Report review.
1. Introduction
This report
presents the Draft Annual Report 2020/21 against the delivery of year three of
our Long Term Plan 2018-2028, as updated through our Annual Plan 2020/21. These
reports contain the draft financial and non-financial performance results of
the Council for the year ended 30 June 2021.
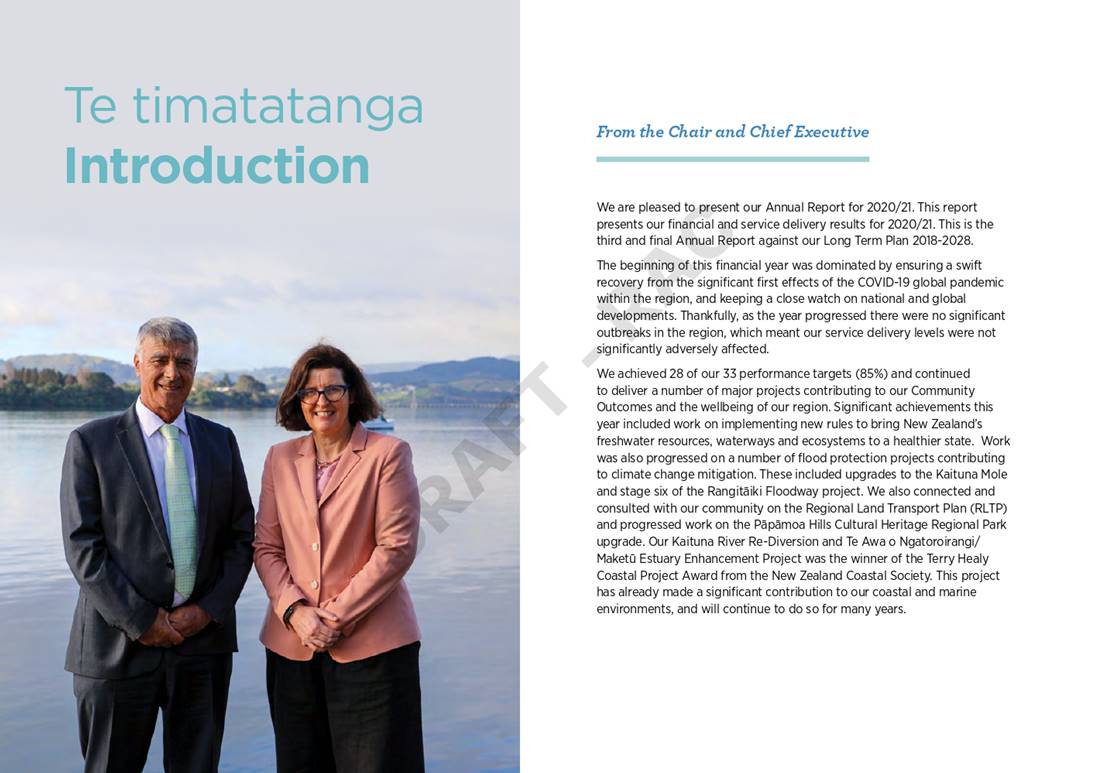
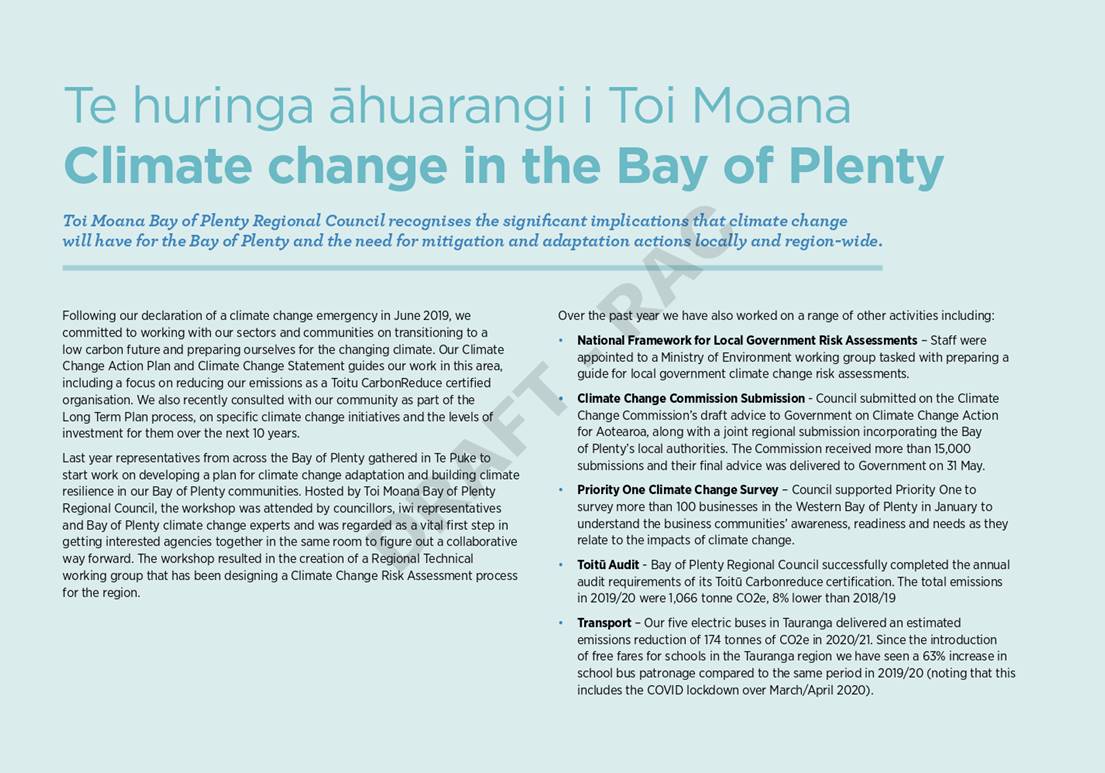
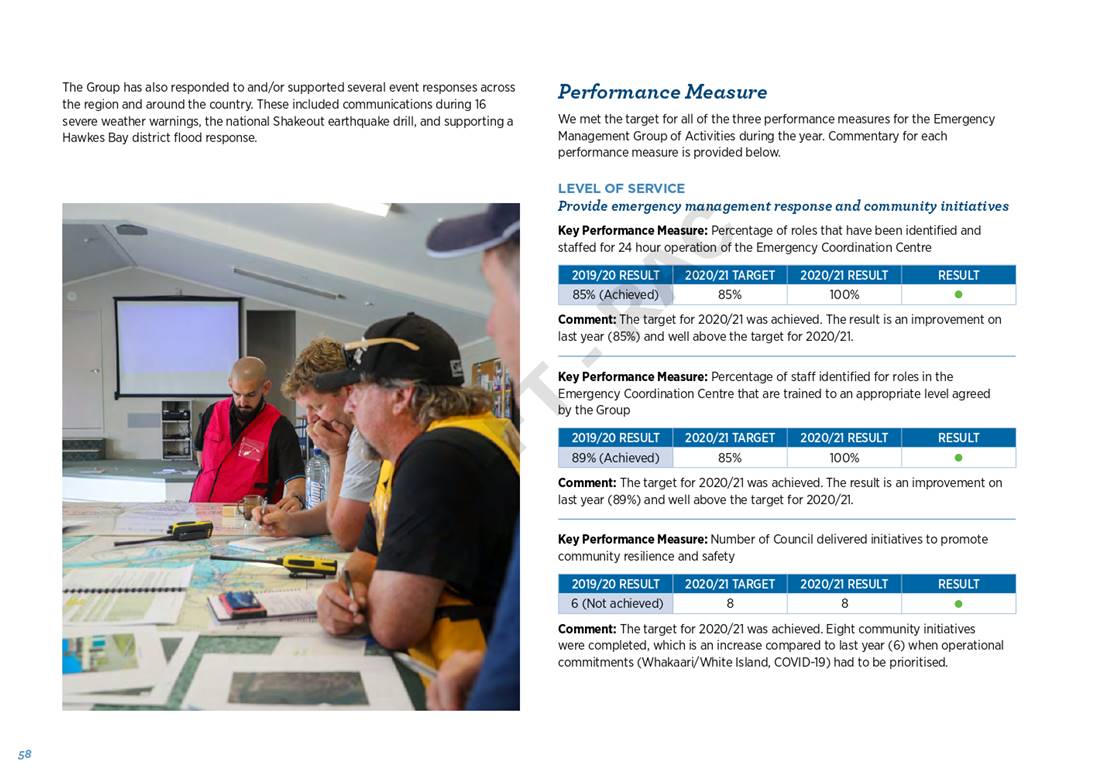
The beginning
of this financial year was dominated by ensuring a swift recovery from the
significant first effects of the COVID-19 global pandemic within the region,
and keeping a close watch on national and global developments. Thankfully, as
the year progressed there were no significant outbreaks in the region, which
meant Council’s service delivery levels were not significantly adversely
affected.
The Council
meeting on the 10 November 2021 is scheduled to receive and adopt the Annual
Report and Annual Report Summary for the year ended 30 June 2021. The
supporting documents, Draft Annual Report 2020/21 (Volume One and Volume Two
Financials) are provided to the Risk and Assurance Committee in its role to
receive and review the draft Annual Report.
The Audit New
Zealand Director, Leon Pieterse, and Audit Manager Anton Labuschagne will be in
attendance at the meeting to discuss the overall audit process.
1.1 Legislative Framework
The Draft Annual Report 2020/21
is prepared in accordance with the requirements of the Local Government Act
2002 and the Local Government (Financial Reporting and Prudence) Regulations
2014.
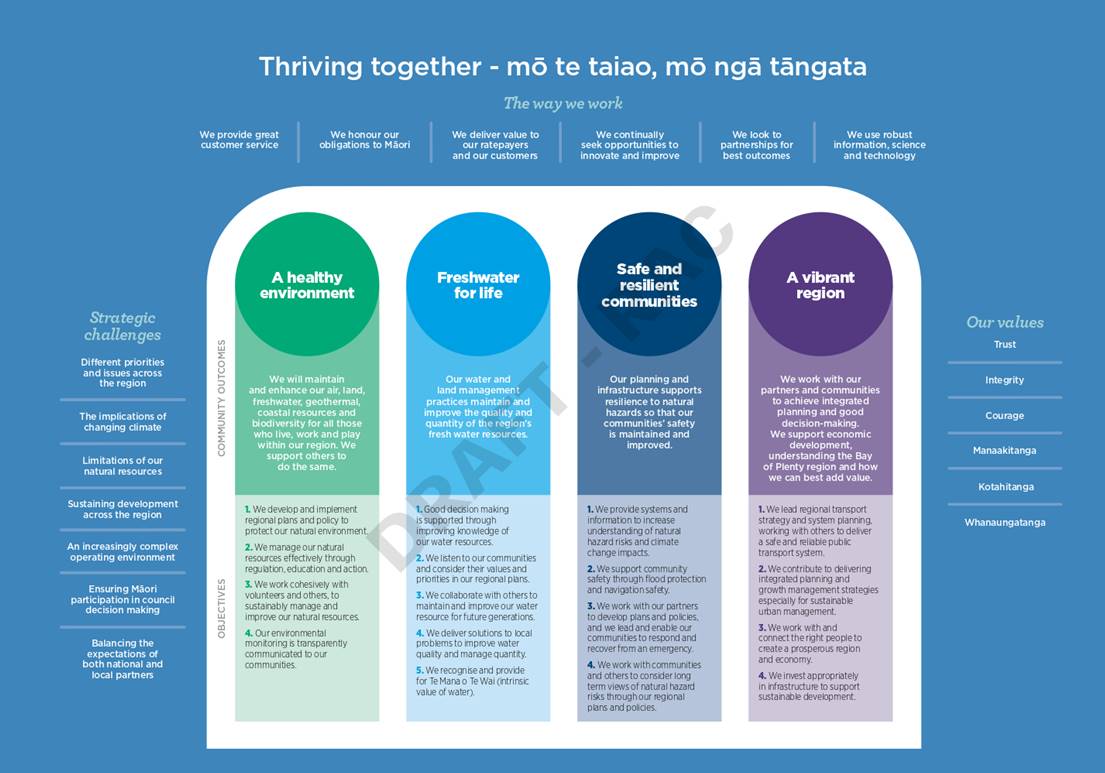
1.2 Alignment with
Strategic Framework
The Draft Annual Report 2020/21
provides a report on the financial and non-financial performance of Council as
set out in its Long Term Plan 2018-2028 and Annual Plan 2020/21. As a result it
supports the delivery of all four Community Outcomes and the Way We Work.
1.2.1 Community Well-beings Assessment
|
Dominant Well-Beings Affected
|
|
þ Environmental
|
þ Cultural
|
þ Social
|
þ Economic
|
The Draft Annual Report 2020/21
provides a report on the financial and non-financial performance of Council and
as such promotes all four aspects of community well-being.
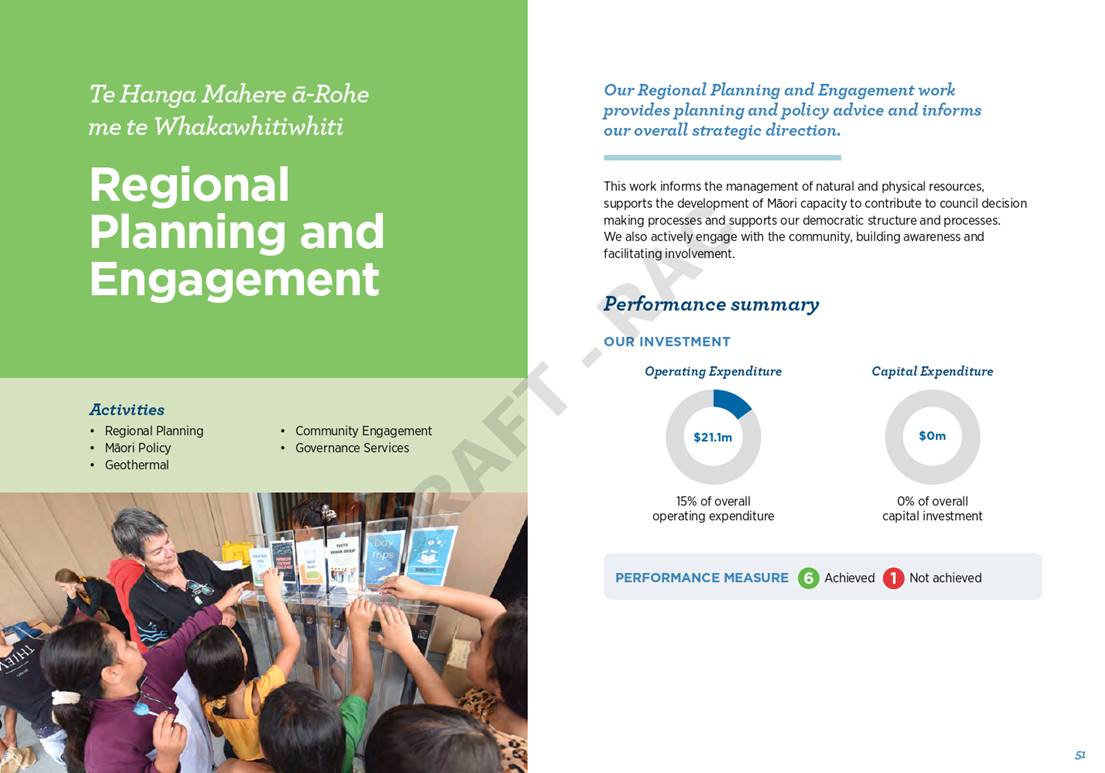
2. Draft Annual Report 2020/21
2.1 Non-Financial
Performance Summary 2020/21
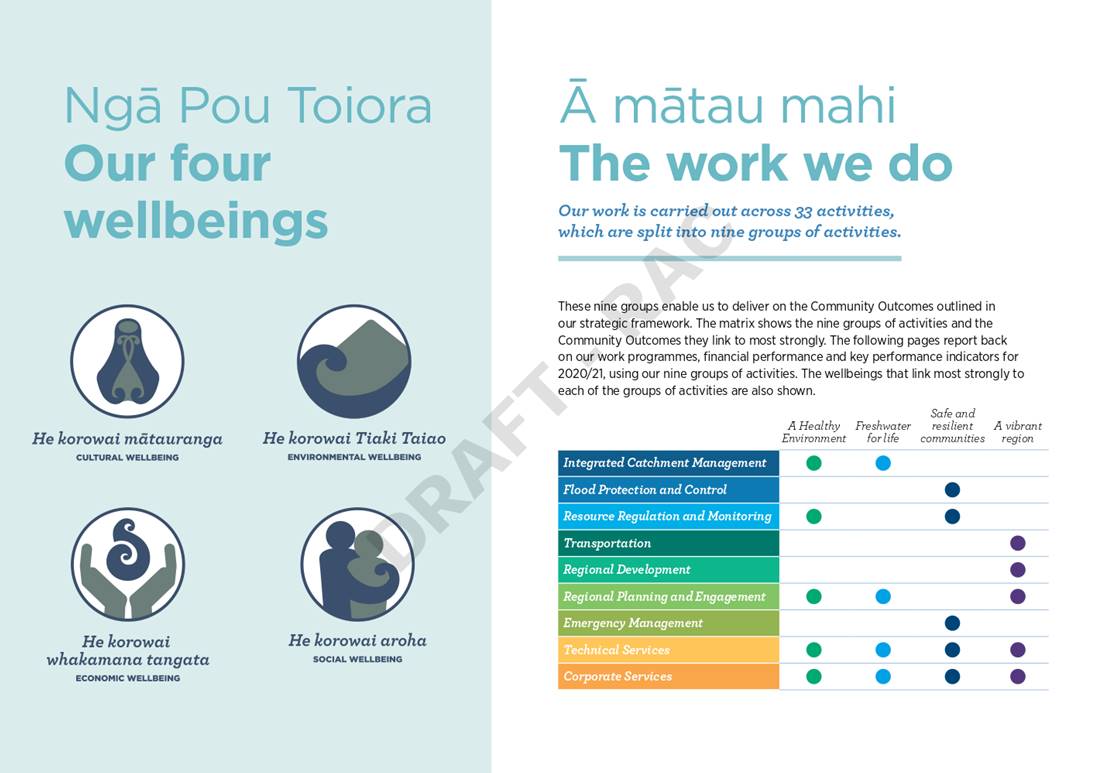
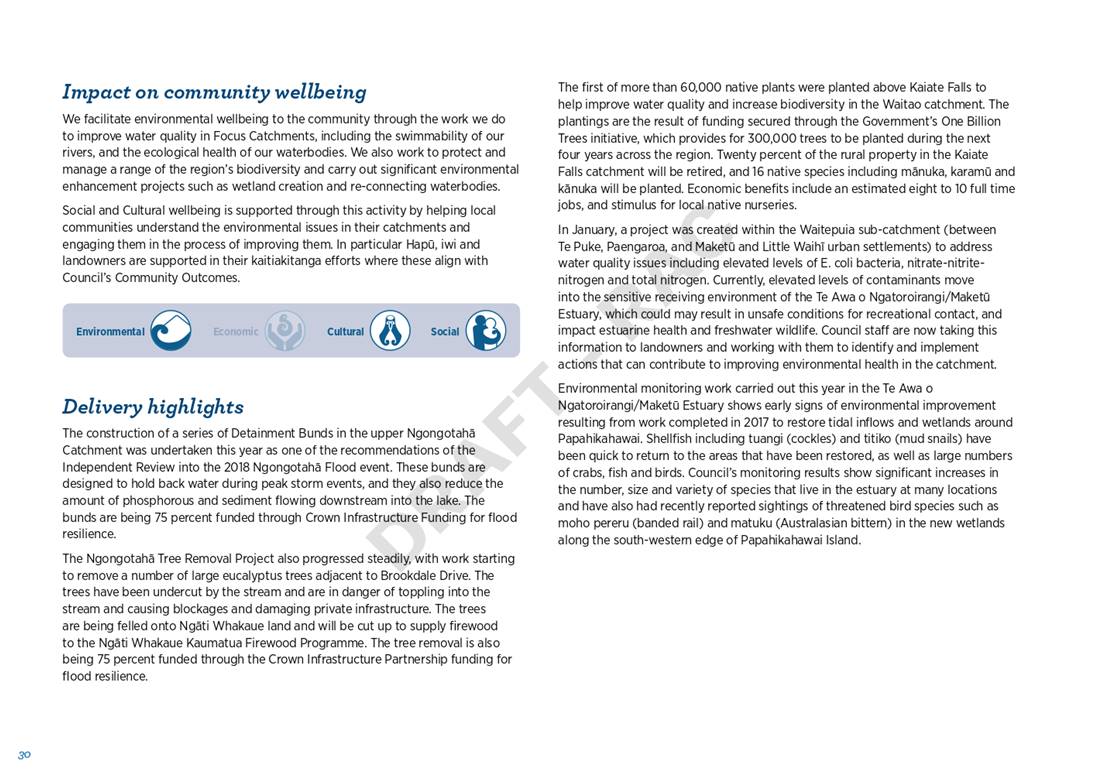
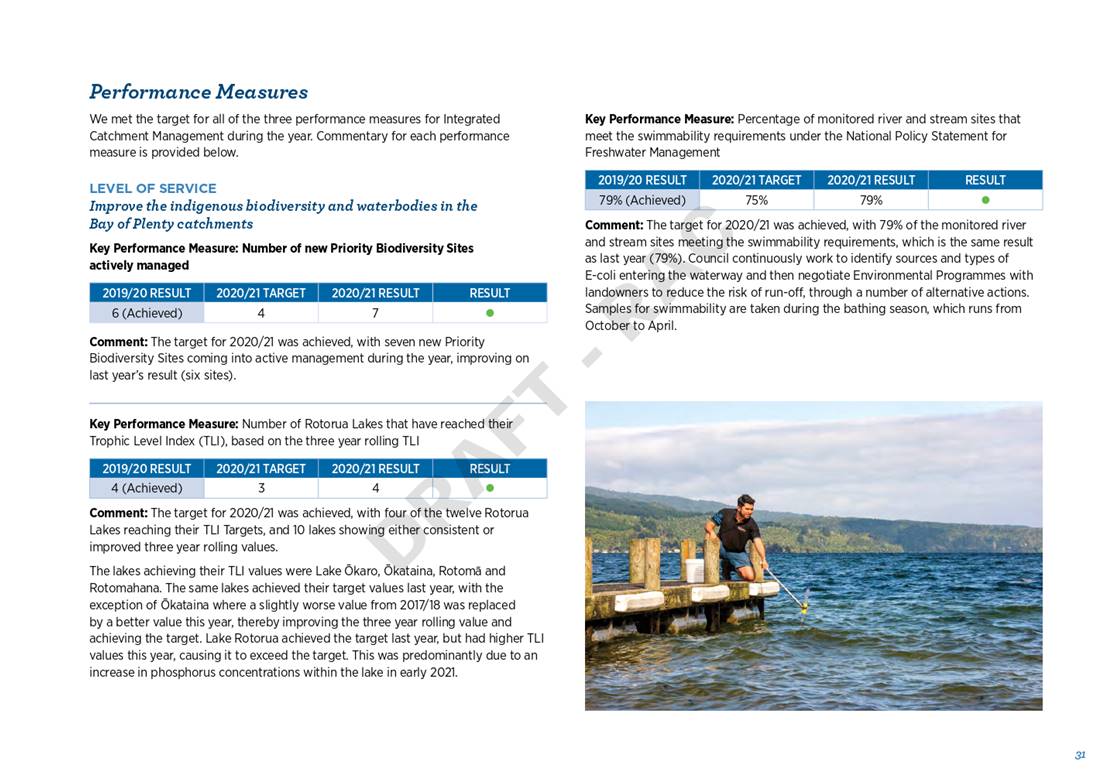
Through the
Long Term Plan 2018-2028, Council set the Levels of Service it will provide to
the community for each of the nine Groups of Activities. Council also set
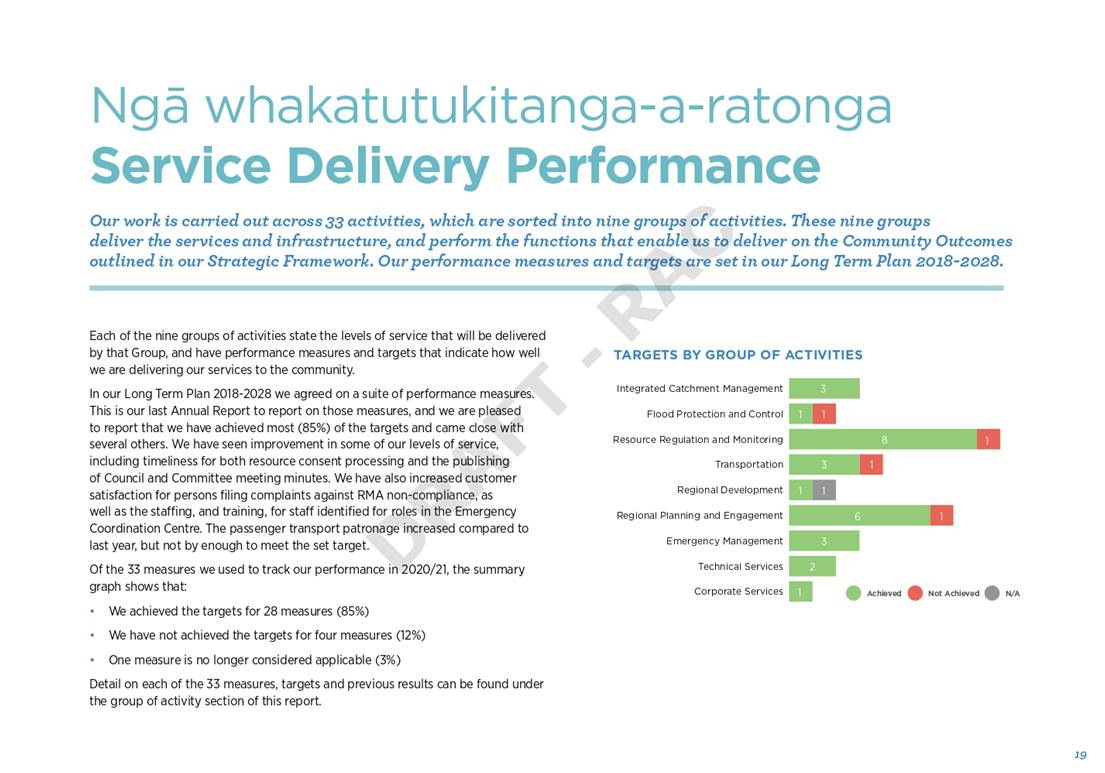
performance measures and targets for those Levels of Service.
In 2020/21
Council achieved 28 out of 33, or 85% of targets for these measures and came
close with several others. While COVID-19 has had an impact on a number of our
services, we have still managed to see improvement in some of our levels of
service, including resource consent processing times and publishing of Council
and Committee meeting minutes.
By comparison,
in 2019/20 Council reported on 33 KPIs and achieved 28 (or 85%) of the targets
and did not achieve five.
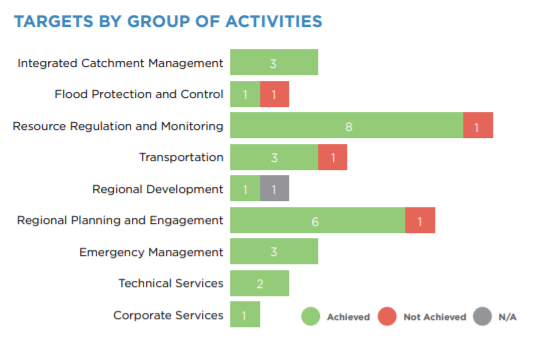
Of the 33
measures that Council used to track its performance in 2020/21, the summary
graph below shows that:
- Council achieved the targets for 28 measures
(85%)
- Council did not achieve the targets for
four measures (12%)
- One measure is no longer considered applicable
(3%)
2.1.1 Performance Measures not achieved
Further detail on the measures
where the target has not been met are provided in the table below.
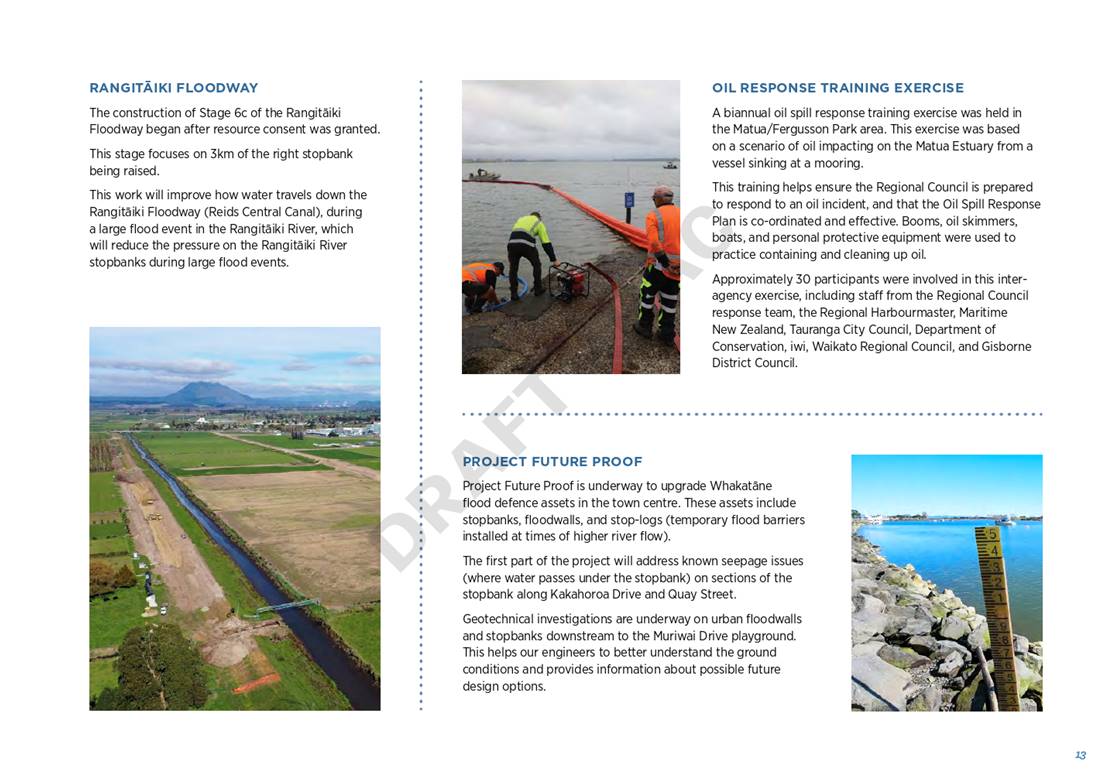
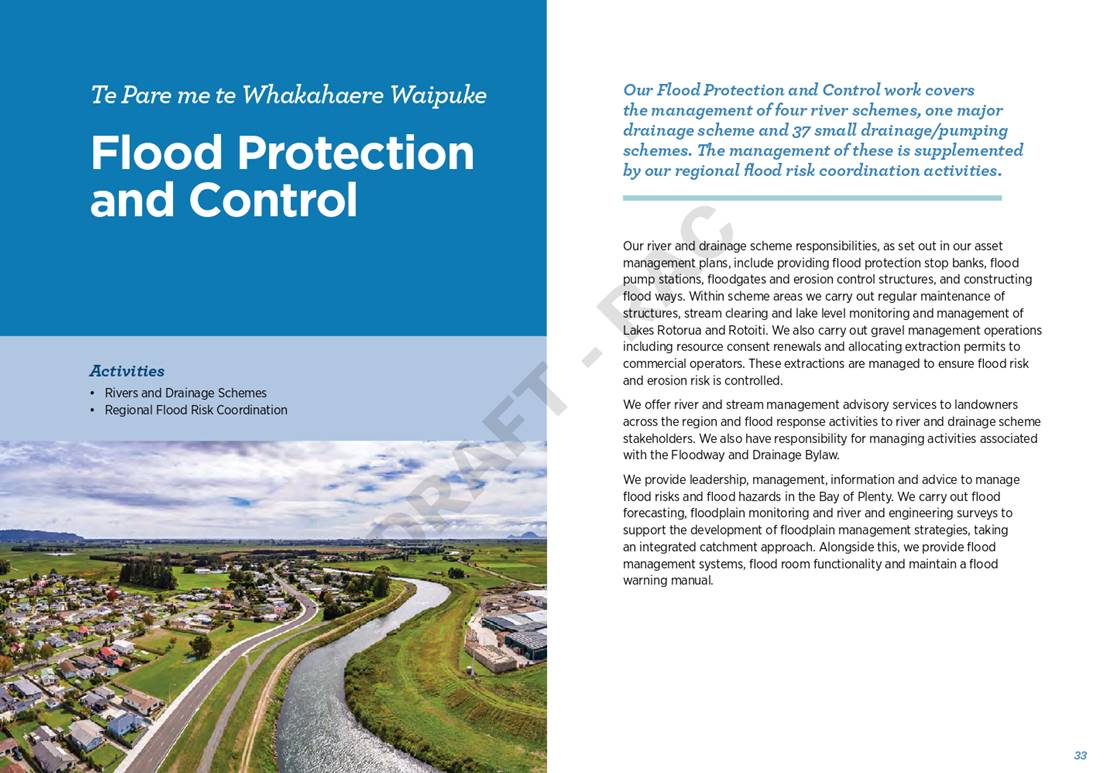
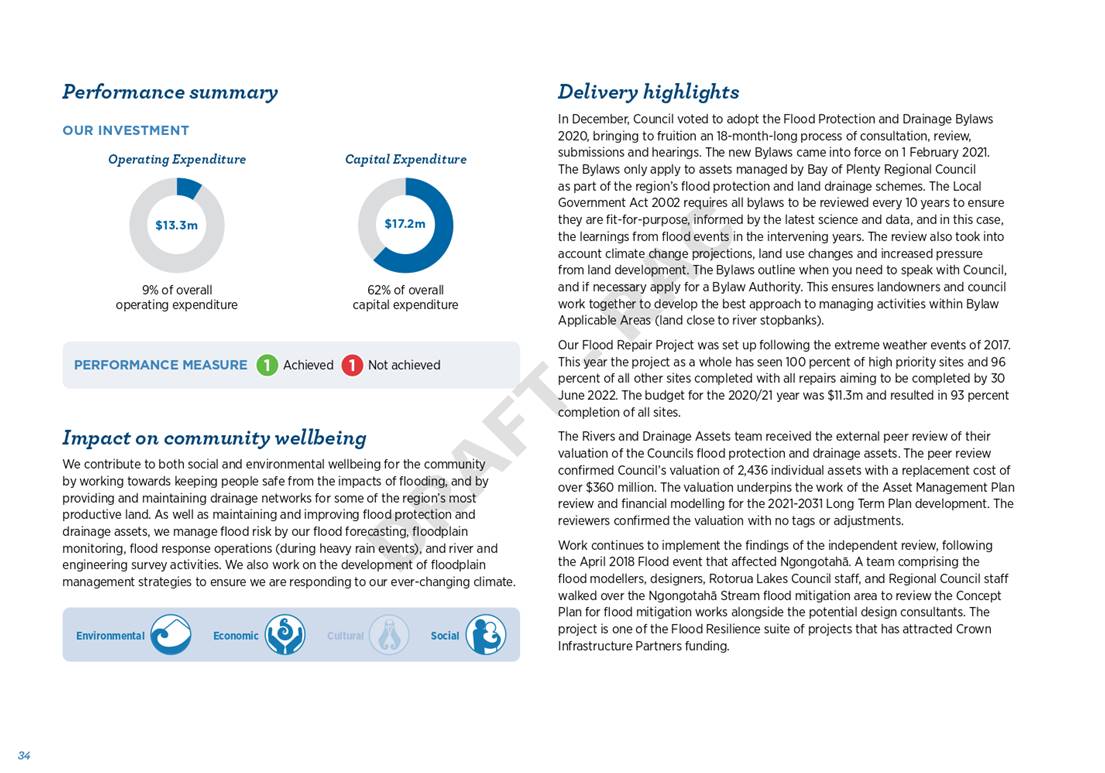
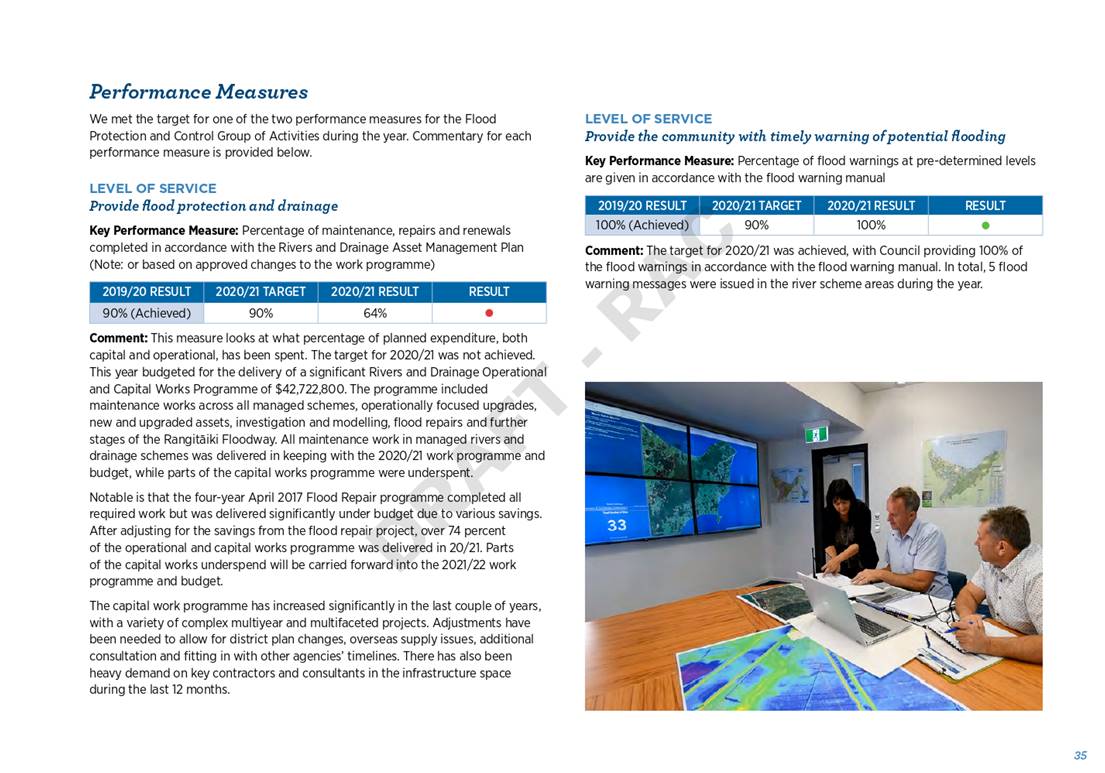
Flood
Protection & Control
Key
Performance Measure: Percentage of maintenance,
repairs and renewals completed in accordance with the Rivers and Drainage Asset
Management Plan (Note: or based on approved changes to the work programme)
|
2019/20
RESULT
|
2020/21
TARGET
|
2020/21
RESULT
|
RESULT
|
|
90% (Achieved)
|
90%
|
65%
|
Ÿ
|
This measure looks at what
percentage of planned expenditure, both capital and operational, has been
spent. The target for 2020/21 was not achieved. This year budgeted for the
delivery of a significant Rivers and Drainage Operational and Capital Works Programme
of $42,722,800. The programme included maintenance works across all managed
schemes, operationally focused upgrades, new and upgraded assets, investigation
and modelling, flood repairs and further stages of the Rangitāiki
Floodway. All maintenance work in managed rivers and drainage schemes was
delivered in keeping with the 2020/21 work programme and budget, whilst parts
of the capital works programme were underspent.
Notable is that the 4-year April
2017 Flood Repair programme completed all required work but was delivered
significantly under budget due to various savings. After adjusting for the
savings from the flood repair project, over 74% of the operational and capital
works programme was delivered in 20/21. Parts of the capital works underspend
will be carried forward into the FY 2021/22 work programme and budget.
The capital work programme has
increased significantly in the last couple of years, with a variety of complex
multiyear and multifaceted projects. Adjustments have been needed to allow for
district plan changes, overseas supply issues, additional consultation and
fitting in with other agencies timelines. There has also been heavy demand on
key contractors and consultants in the infrastructure space over the last 12
months.
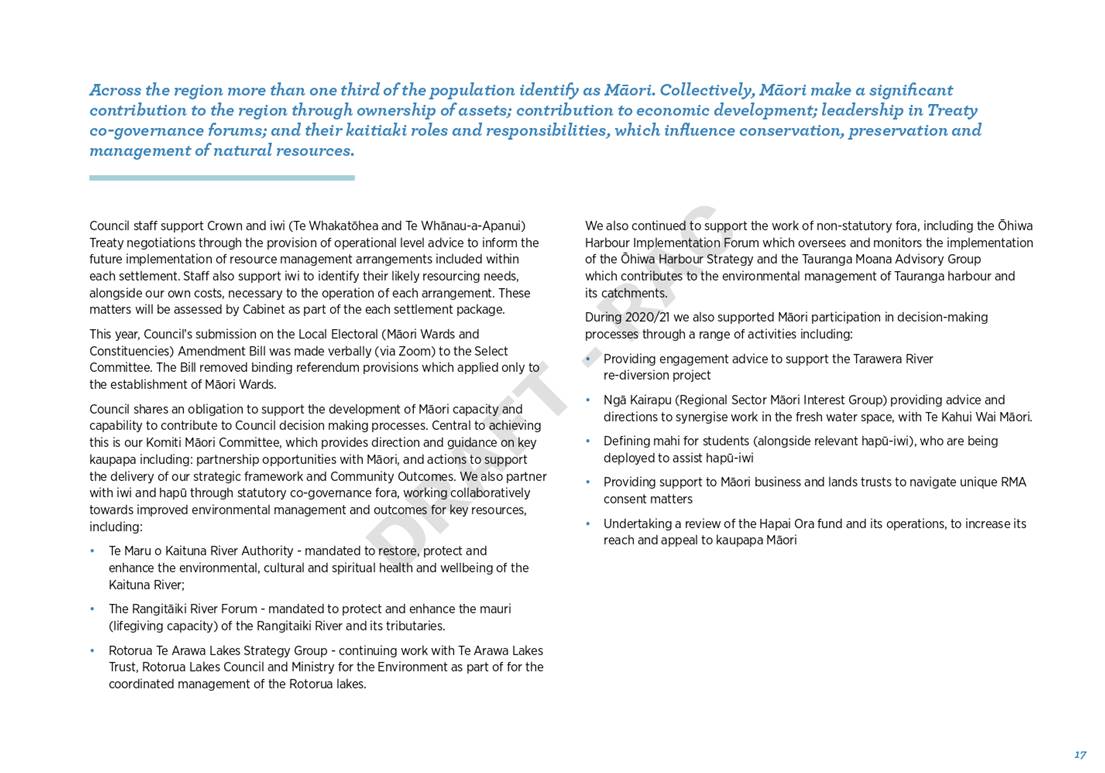
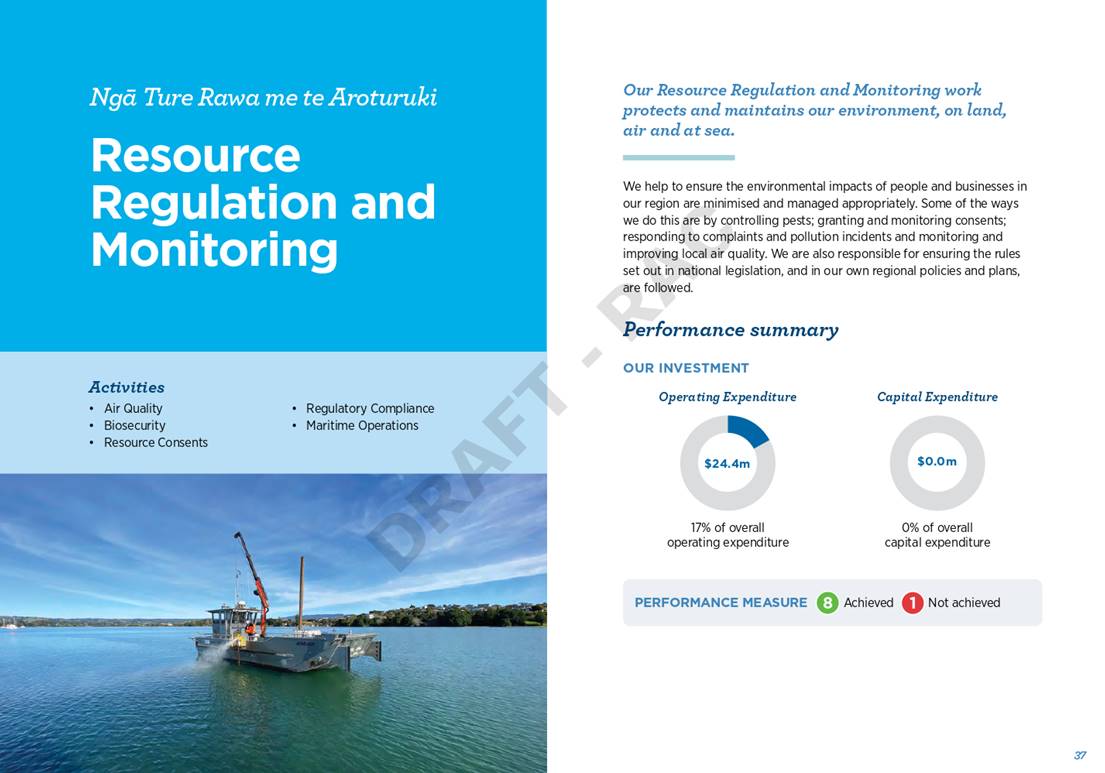
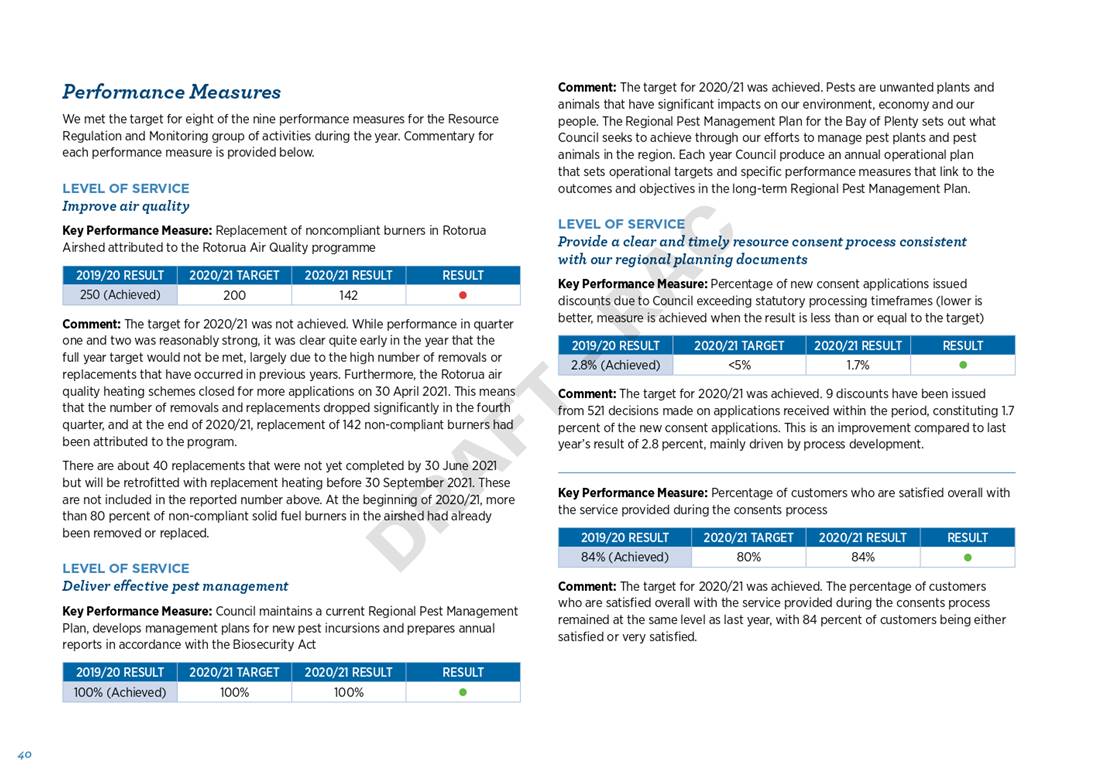
Resource Regulation and
Monitoring
Key Performance Measure:
Replacement of noncompliant burners in Rotorua Airshed attributed to the
Rotorua Air Quality programme.
|
2019/20
RESULT
|
2020/21
TARGET
|
2020/21
RESULT
|
RESULT
|
|
280
|
200
|
142
|
Ÿ
|
The target for 2020/21 was not
achieved. While performance in Quarter One and Two was reasonably strong, it
was clear quite early in the year that the full year target would not be met,
largely due to the high number of removals or replacements that have occurred
in previous years. Furthermore, the Rotorua air quality heating schemes closed
for more applications on 30 April 2021. This means that the number of removals
and replacements dropped significantly in the fourth quarter, and at the end of
2020/21, replacement of 142 non-compliant burners had been attributed to the
program.
There are about 40 replacements
that were not yet completed by 30 June 2021 but will be retrofitted with
replacement heating before 30 September 2021. These are not included in the
reported number above. At the beginning of 2020/21, more than 80 percent of
non-compliant solid fuel burners in the airshed had already been removed or
replaced.
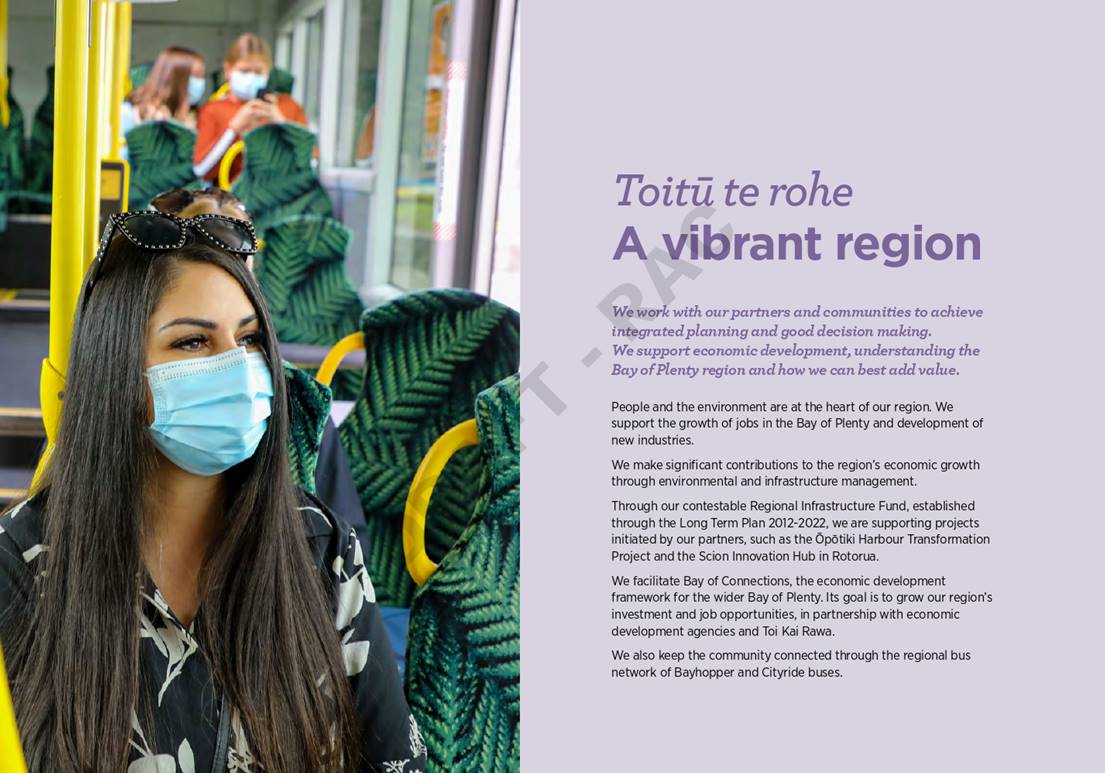
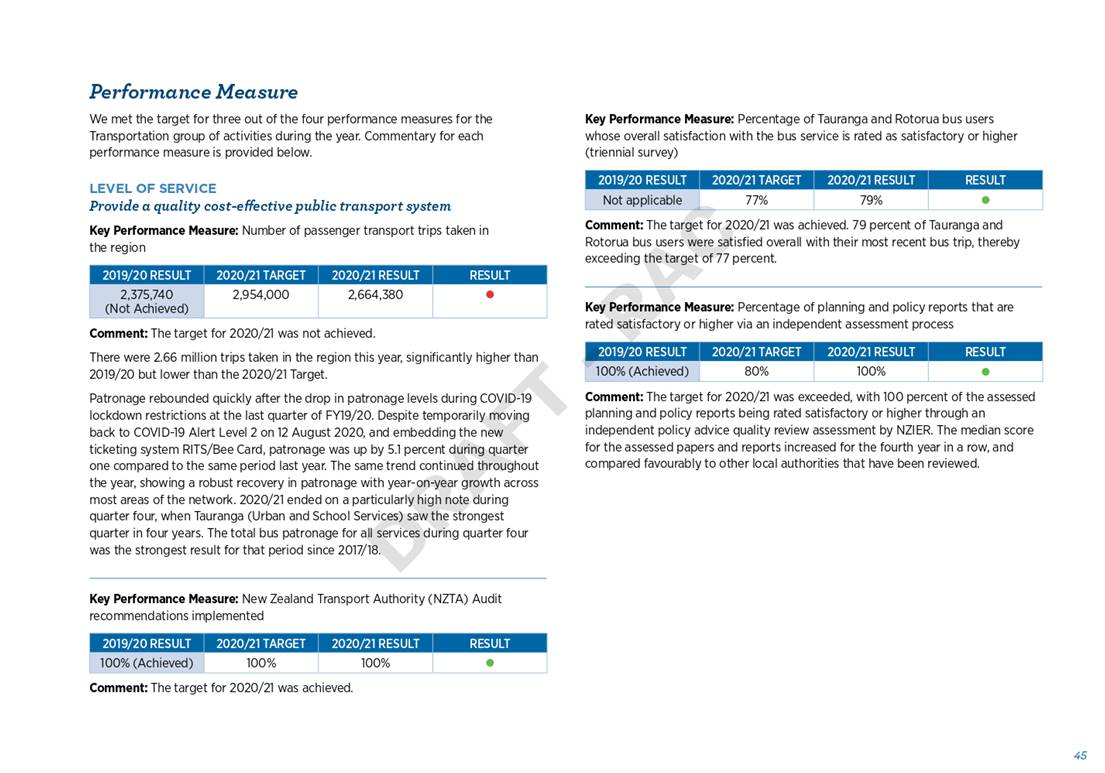
Transportation
Key Performance Measure:
Number of passenger transport trips taken in the region.
|
2019/20
RESULT
|
2020/21
TARGET
|
2020/21
RESULT
|
RESULT
|
|
2,375,740 (Not
Achieved)
|
2,954,000
|
2,664,380
|
Ÿ
|
The target for 2020/21 was not
achieved. There were 2.66 million trips taken in the region this year,
significantly higher than 2019/20, but lower than the 2020/21 Target.
Patronage rebounded quickly
after the drop in patronage levels during COVID-19 lockdown restrictions at the
last quarter of FY19/20. Despite temporarily moving back to COVID-19 Alert
Level 2 on 12 August 2020, and embedding the new ticketing system RITS/Bee
Card, patronage was up by 5.1% during Quarter 1 compared to the same period last
year. The same trend continued throughout the year, showing a robust recovery
in patronage with year-on-year growth across most areas of the network. 2020/21
ended on a particularly high note during Quarter 4, when Tauranga (Urban and
School Services) saw the strongest quarter in four years. The total bus
patronage for all services during Quarter 4 was the strongest result for that
period since 2017/18.
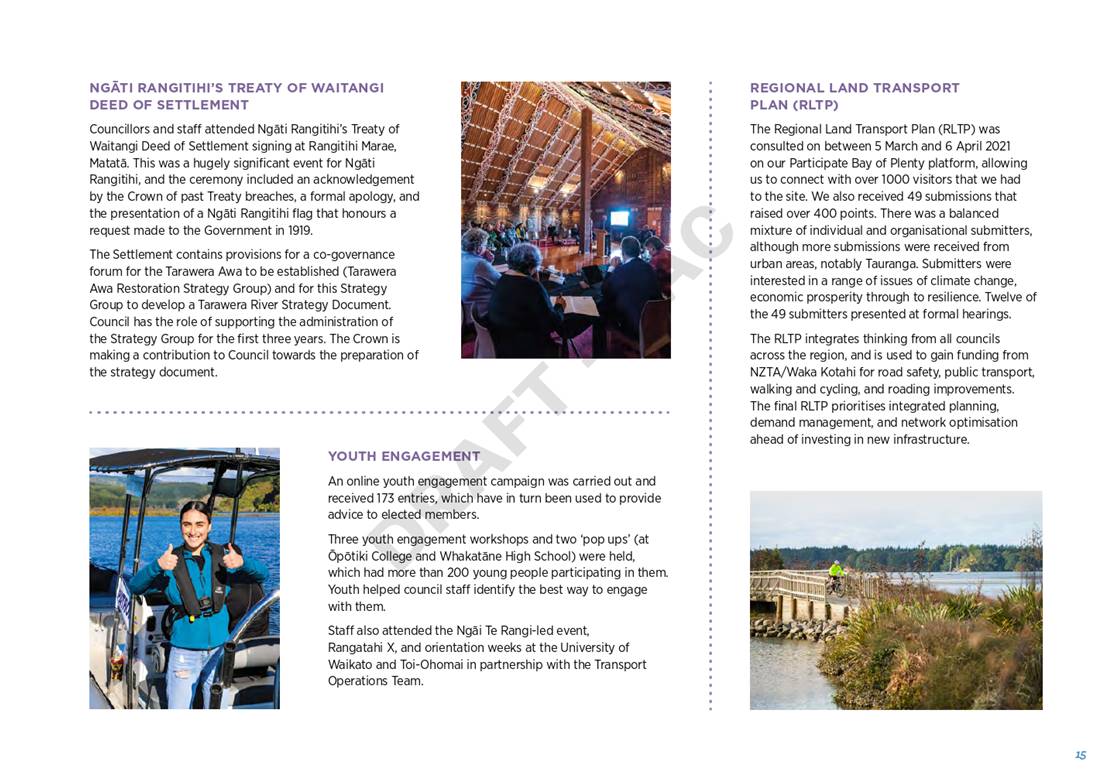
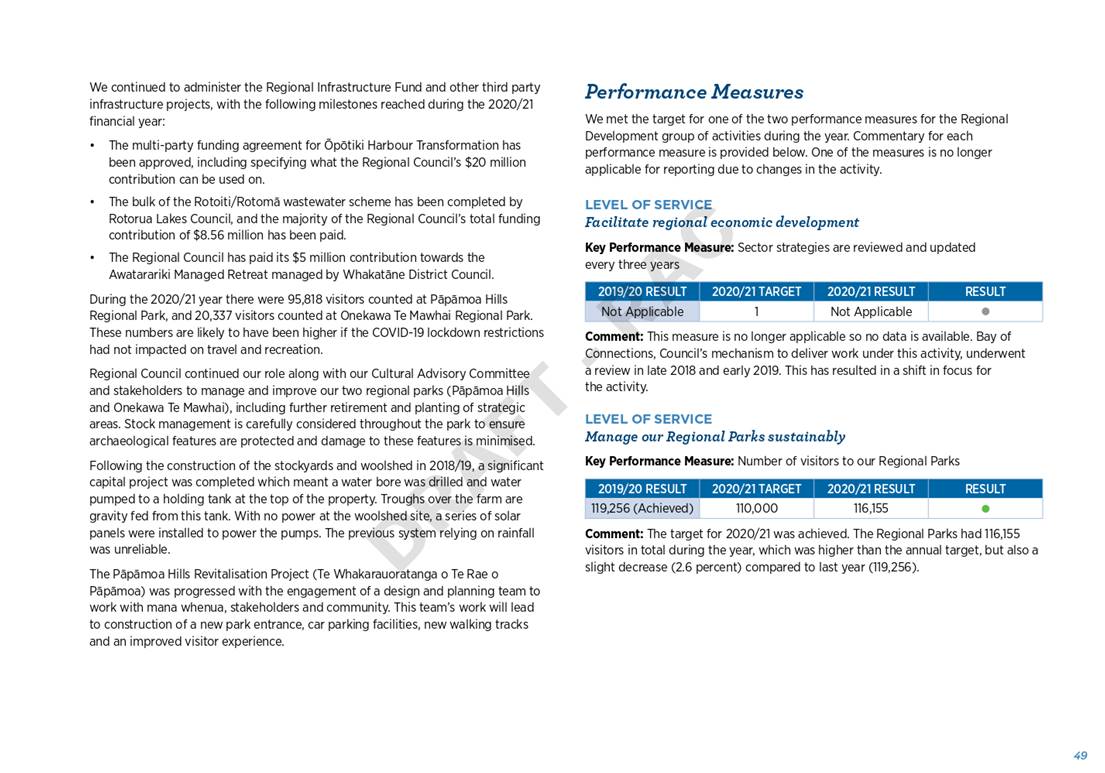
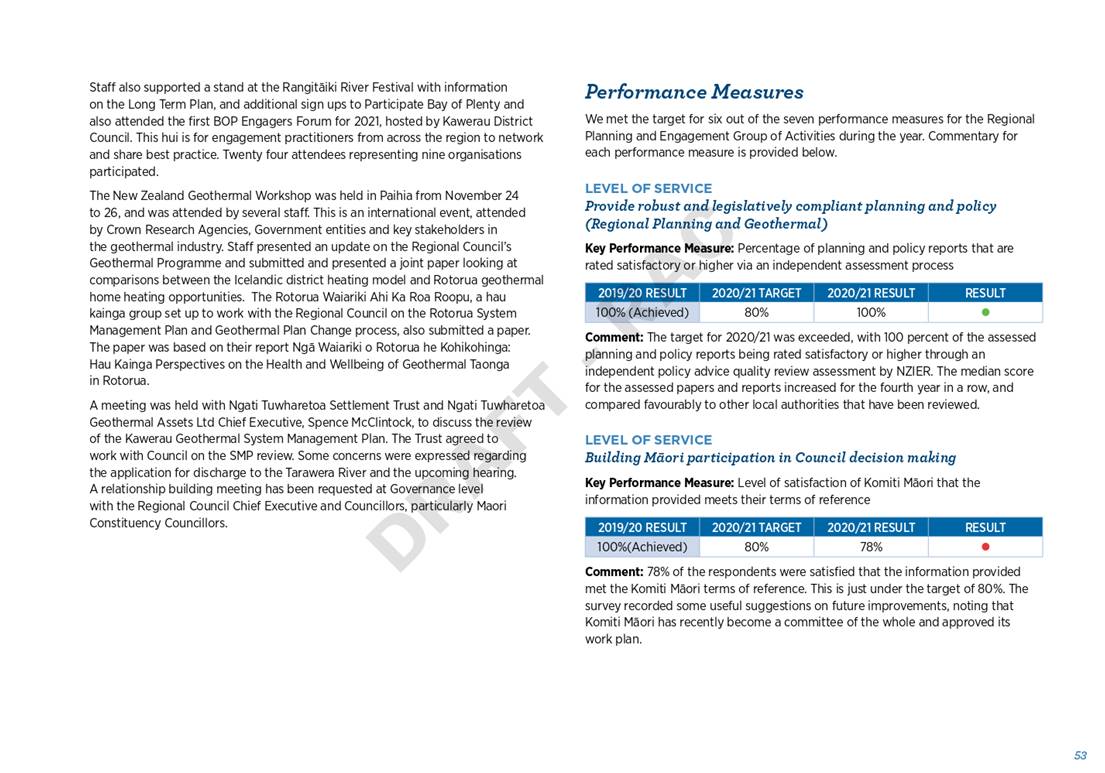
Building Māori
participation in Council decision making
Key Performance Measure:
Level of satisfaction of Komiti Māori that the information provided meets
their terms of reference.
|
2019/20 RESULT
|
2020/21 TARGET
|
2020/21 RESULT
|
RESULT
|
|
100%(Achieved)
|
80%
|
78%
|
Ÿ
|
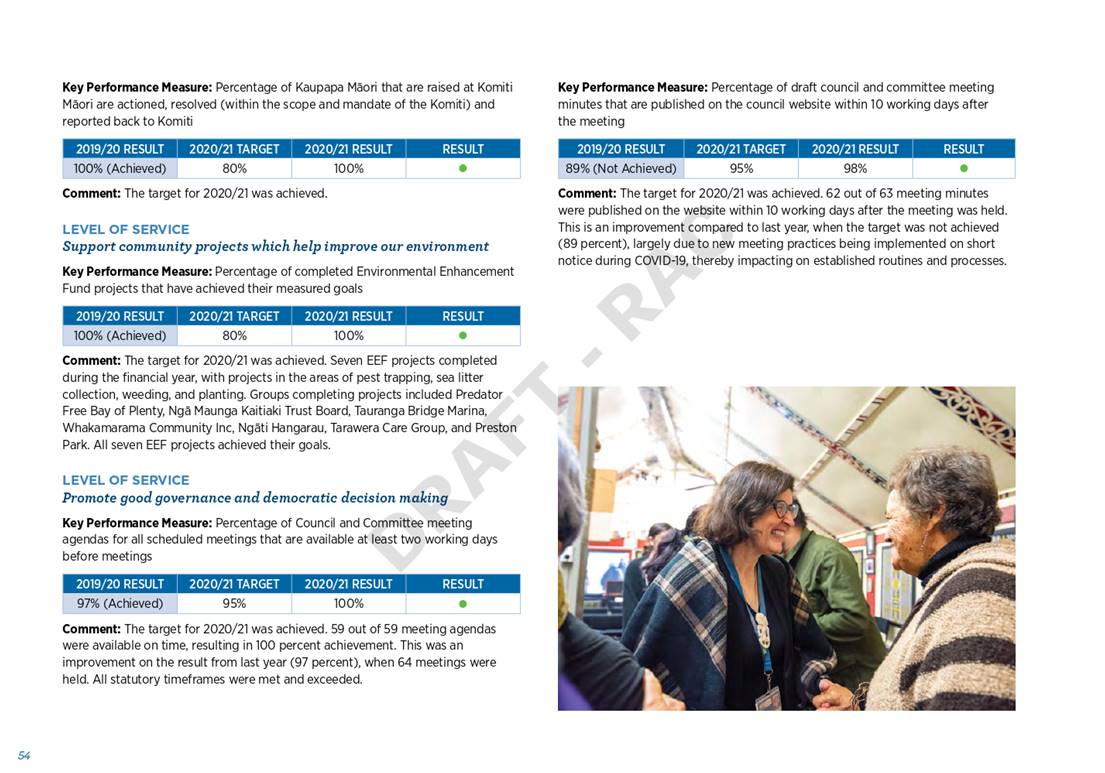
78% of the respondents were
satisfied that the information provided met the Komiti Māori terms of reference. This is just under the target
of 80%. The survey
recorded some useful suggestions on future improvements, noting that Komiti
Māori has recently become a committee of the whole and approved its work
plan.
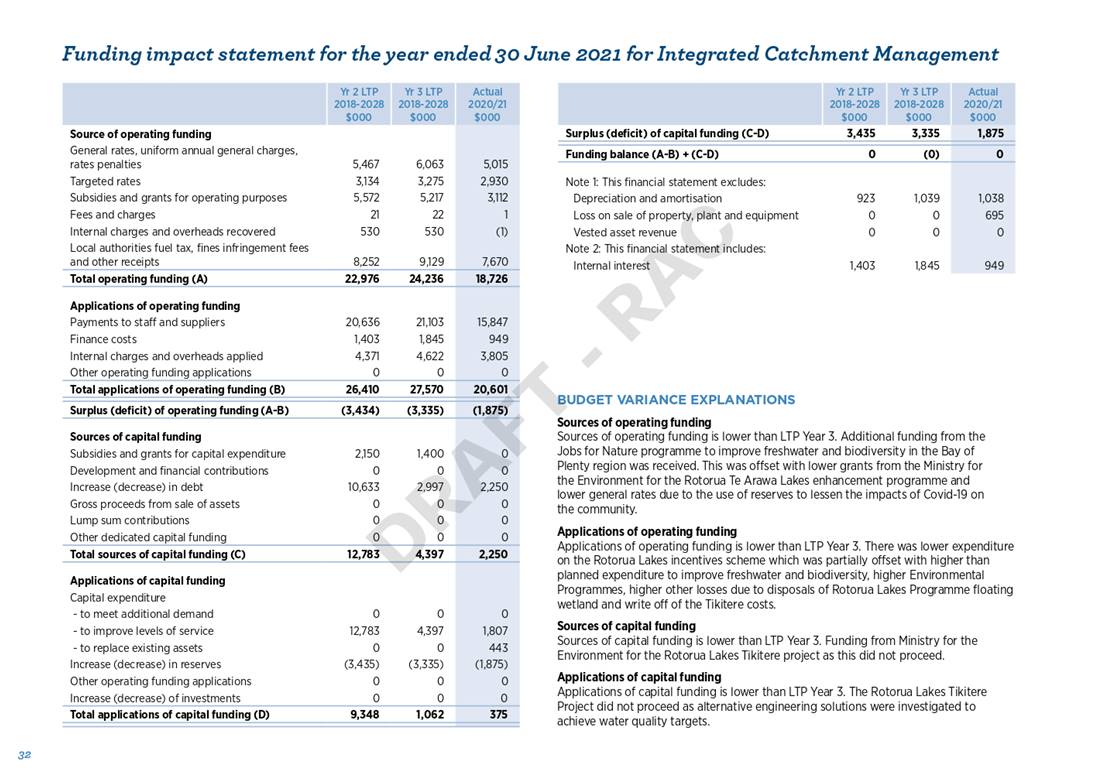
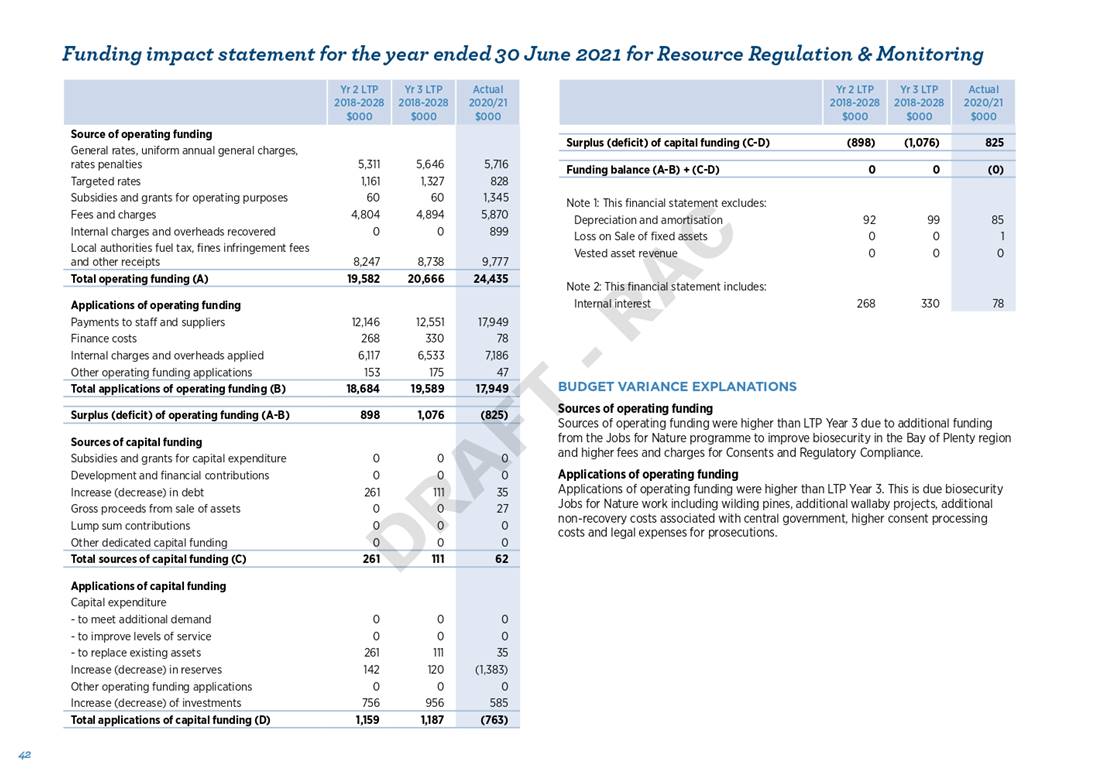
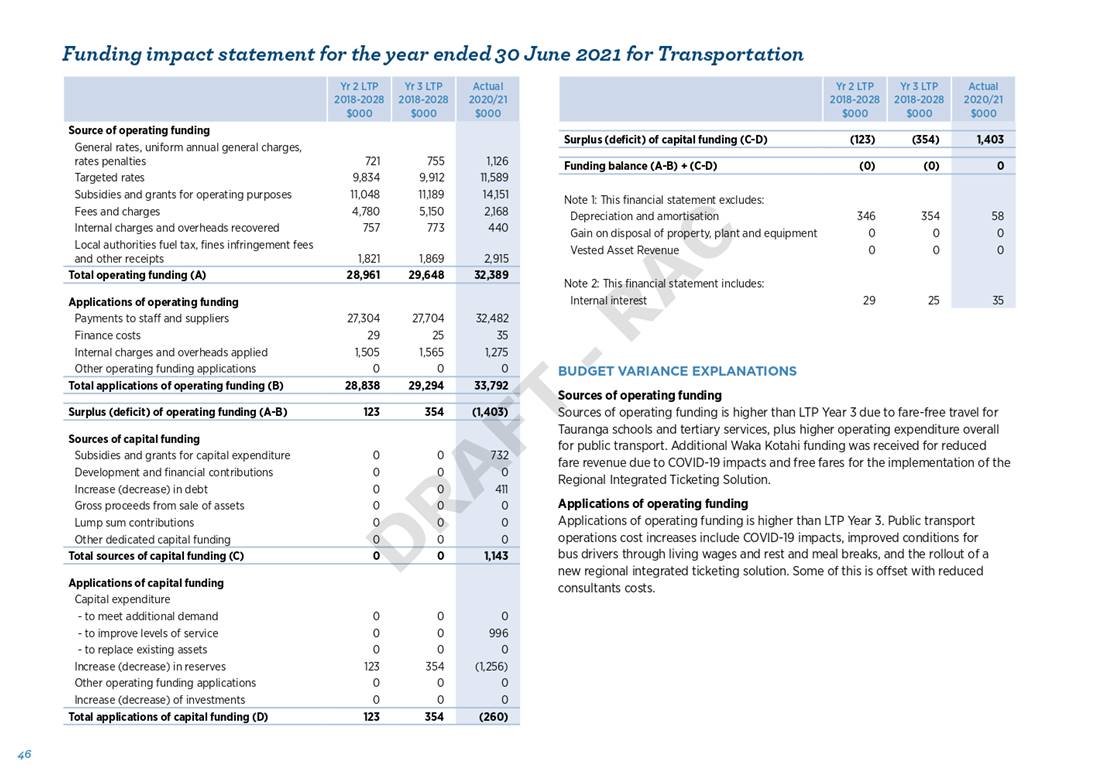
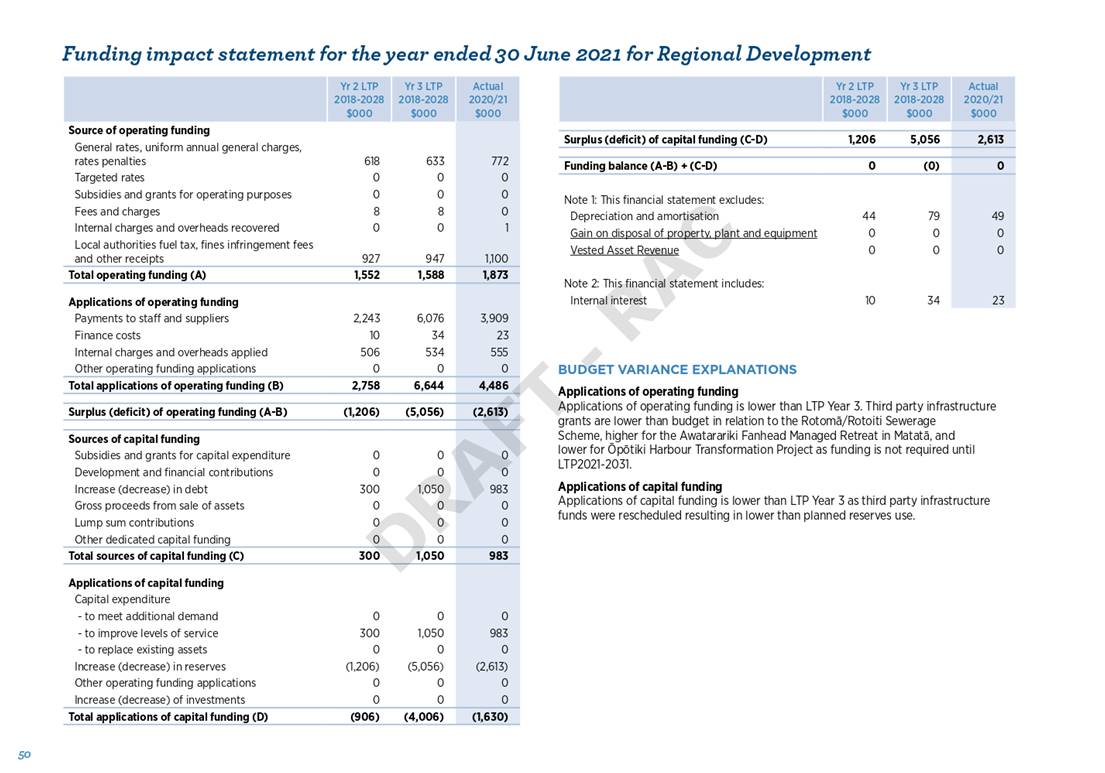
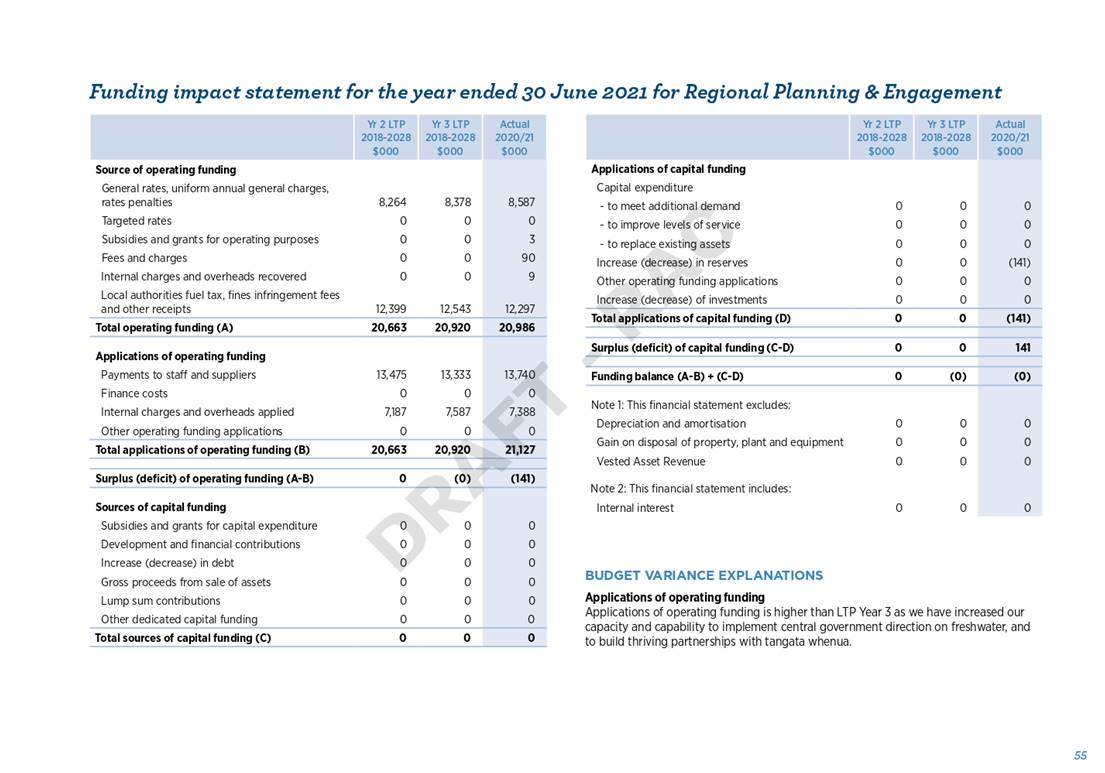
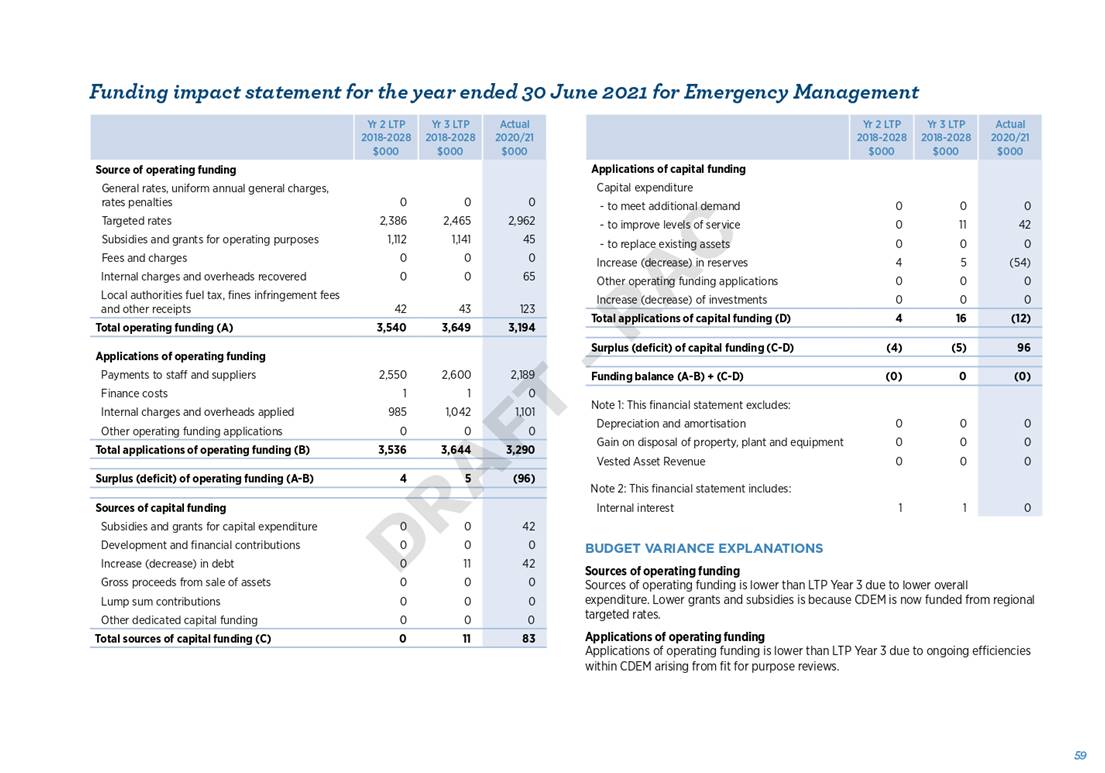
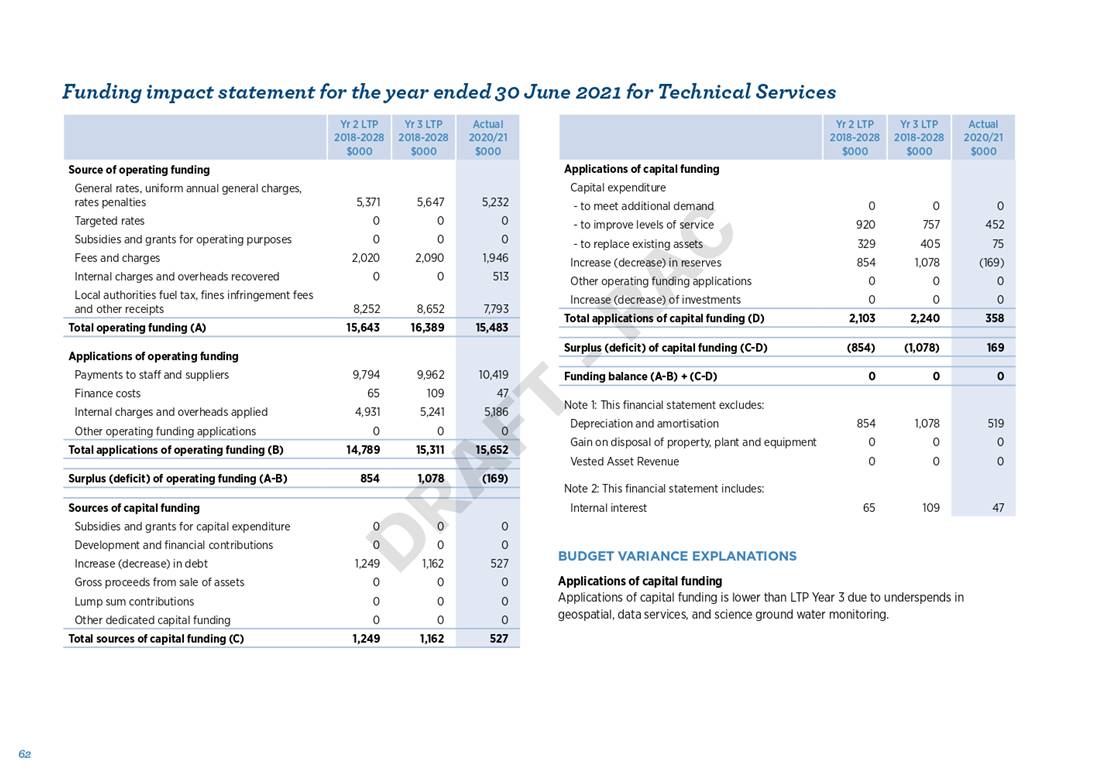
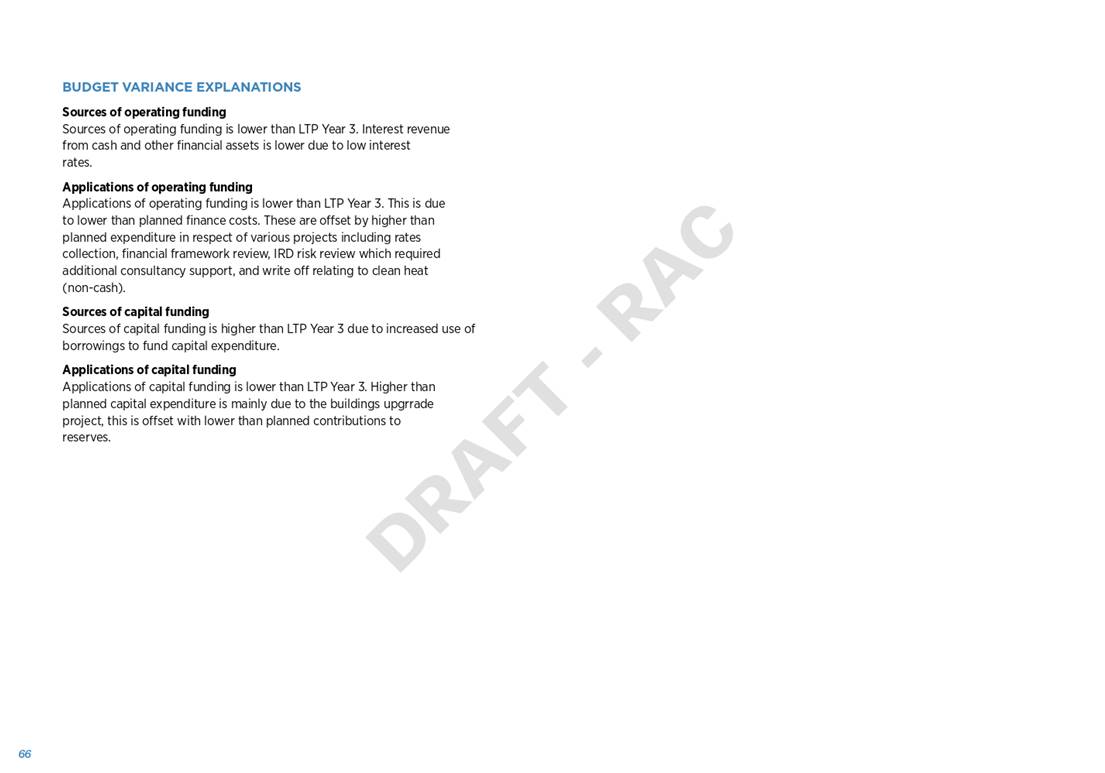
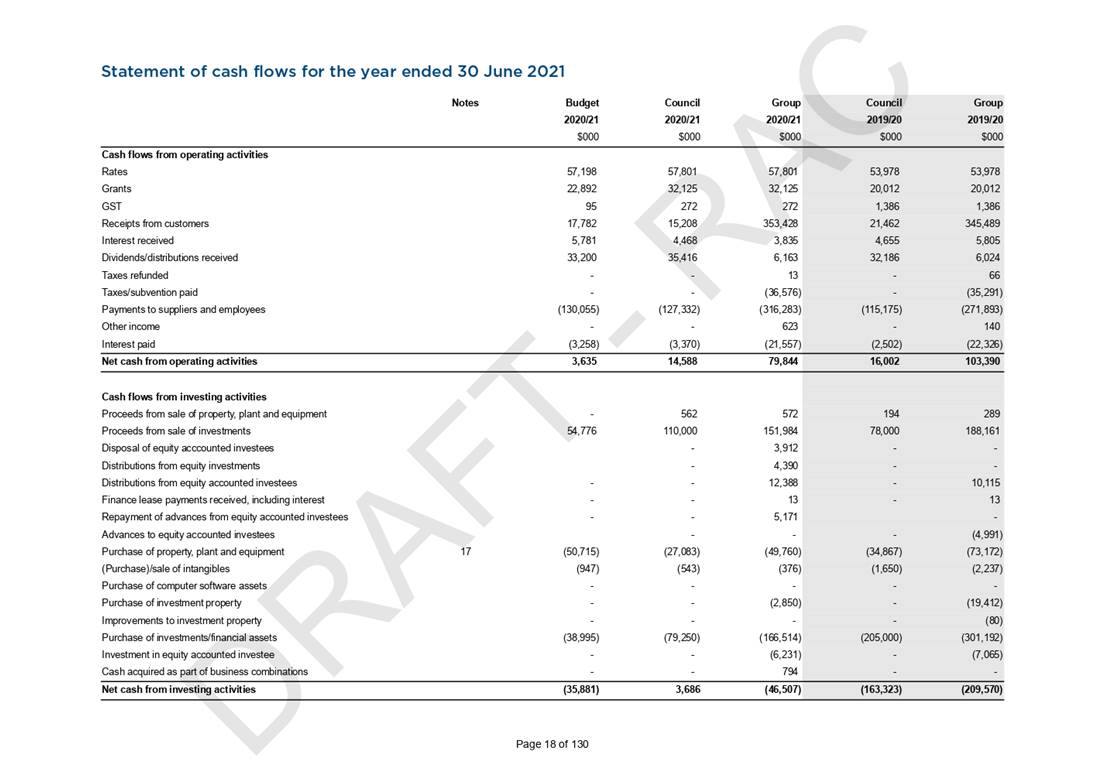
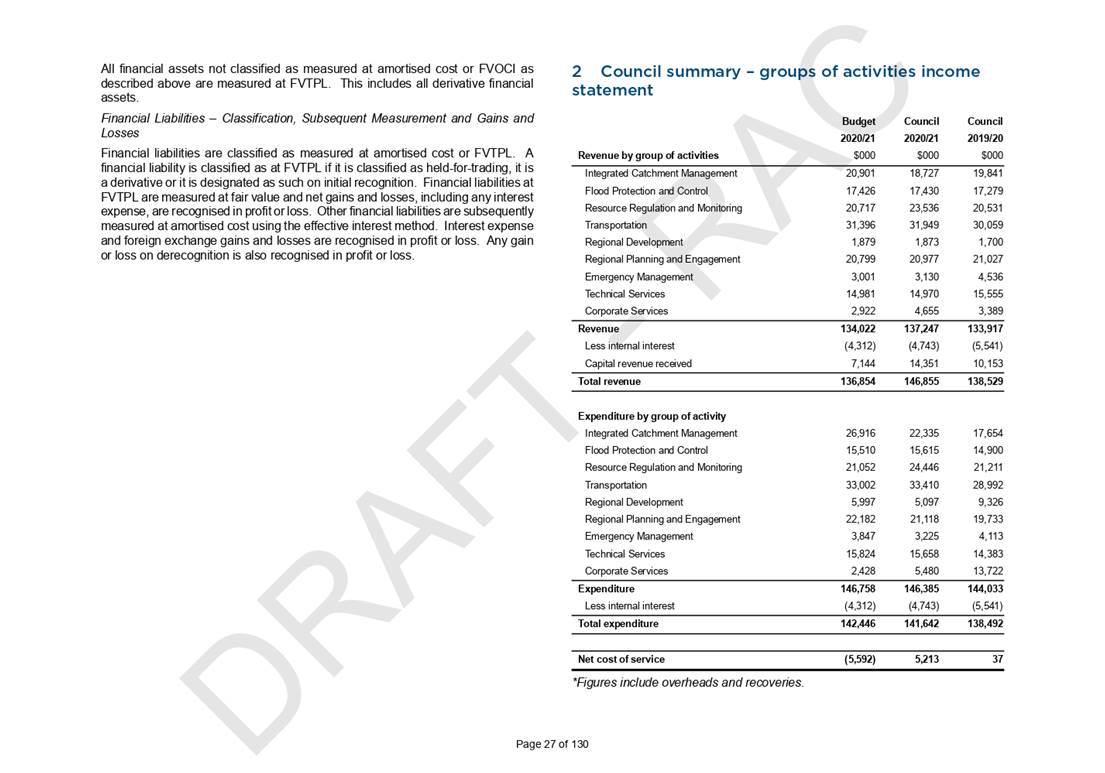
2.2 Financial Performance
Summary 2020/21
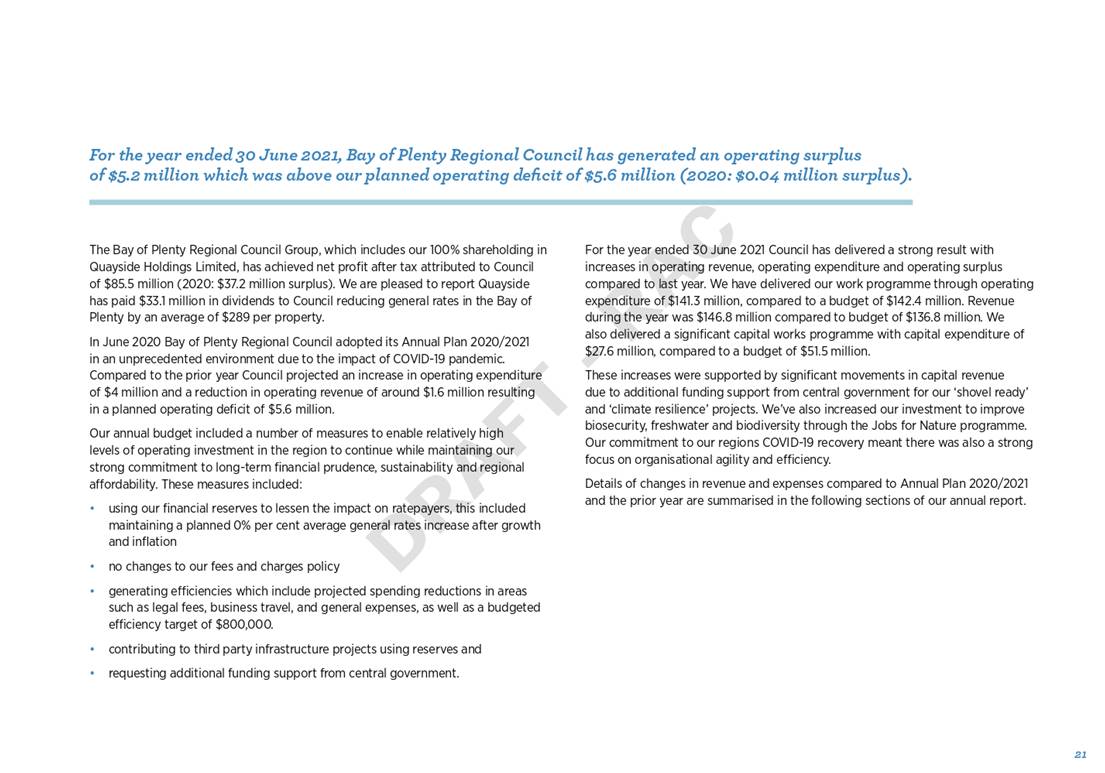
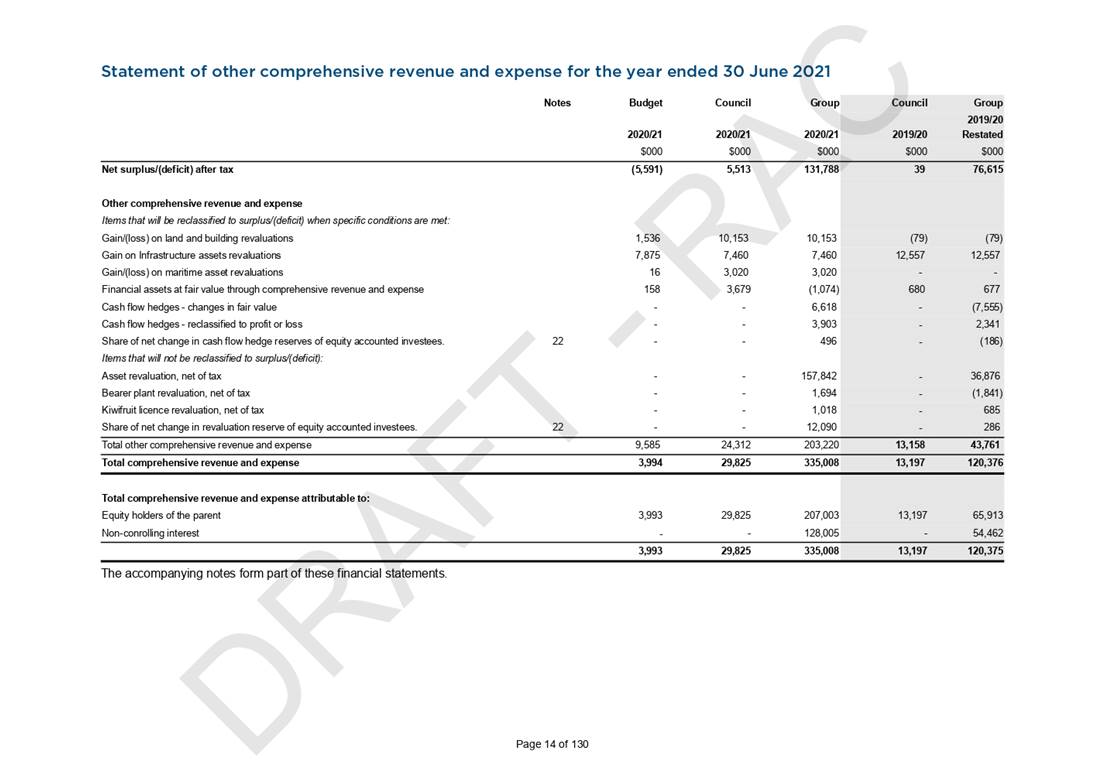
Council’s draft operating surplus
for year three of the Long Term Plan 2018-2028 is $5.5 million which is $11.1
million higher than the budgeted deficit of $5.6 million.
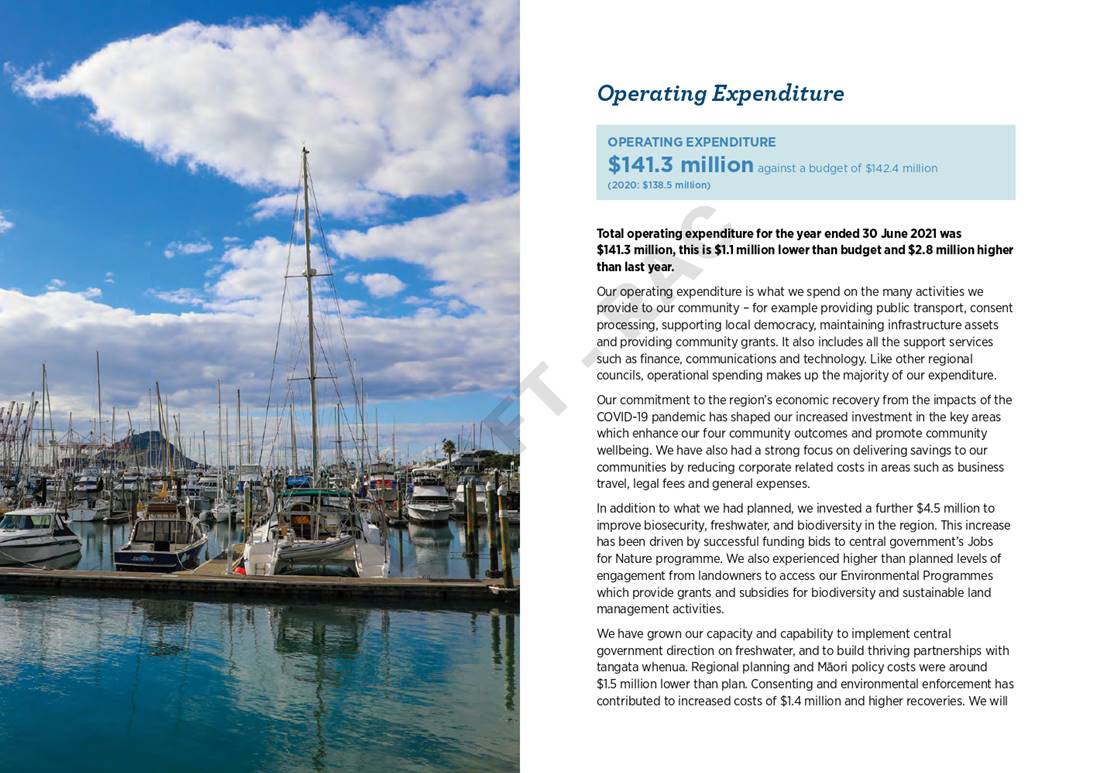
Council delivered its work
programme through operating expenditure of $141.3 million (2020: $138.5
million) compared to a budget of $142.4 million; this is $1.1 million lower
than budget. Total operating revenue is $146.8 million, this is $10.0 million higher
than budget of $136.8 million (2020: $138.5 million).
Council delivered a significant
capital works programme with expenditure of $27.6 million (2020: $36.4 million)
compared to a budget of $51.5 million; this is $24 million lower than
budget partly due to the impacts of Covid-19.
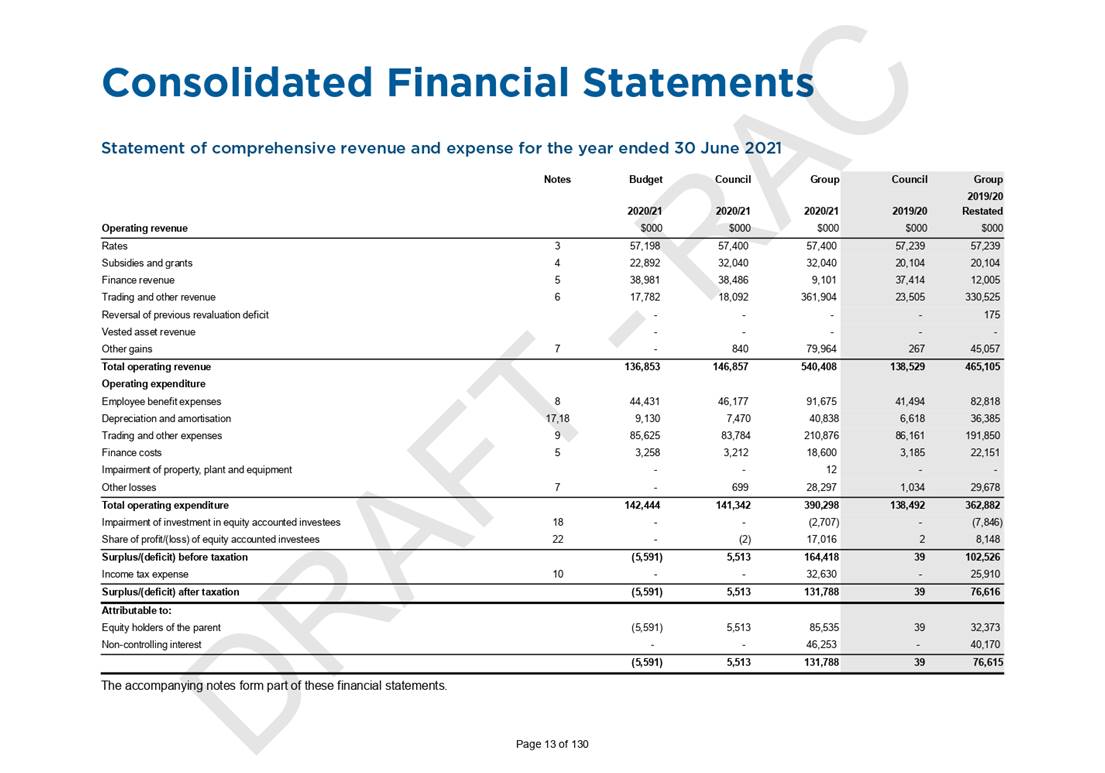
The following table provides a summary of
financial results for the year ended 30 June 2021 as per the Draft Annual
Report 2020/21.
|
Statement of Comprehensive Revenue and
Expense
|
Annual Plan
|
Council
|
Budget v
Actual Variance
|
Group
|
|
2020/21
|
2020/21
|
2020/21
|
2020/21
|
|
$000
|
$000
|
$000
|
$000
|
|
Operating Revenue
|
129,709
|
132,506
|
2,797
|
|
|
Capital Revenue
|
7,144
|
14,351
|
7,207
|
|
|
Total Operating
Revenue
|
136,853
|
146,857
|
10,004
higher
|
540,408
|
|
Total Operating
Expenditure
|
(142,444)
|
(141,342)
|
1,102
lower
|
(390,298)
|
|
Equity Accounted
Investees
|
0
|
2
|
2
|
(14,309)
|
|
Income Tax
|
|
|
|
(32,630)
|
|
Total Surplus /
(Deficit) After Tax
|
(5,591)
|
5,513
|
11,104
higher
|
131,788
|
|
Equity Holders of
Parent
|
5,591
|
(5,513)
|
|
85,535
|
|
Non-Controlling
Interest
|
|
|
|
46,253
|
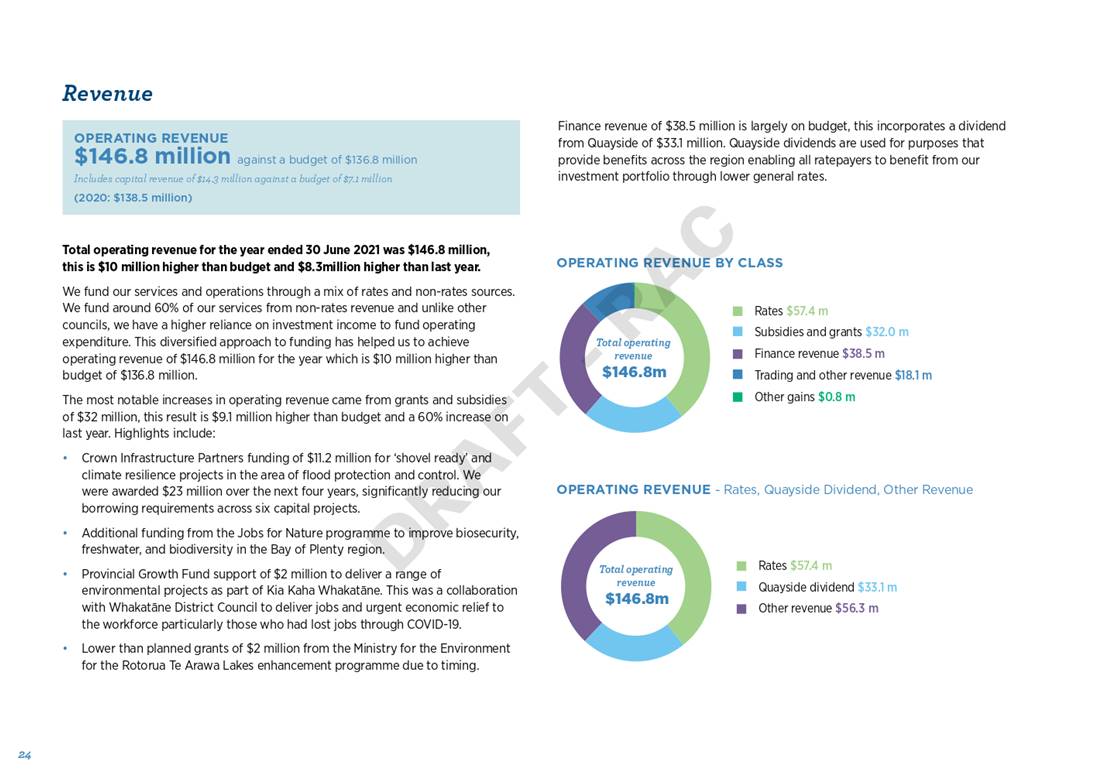
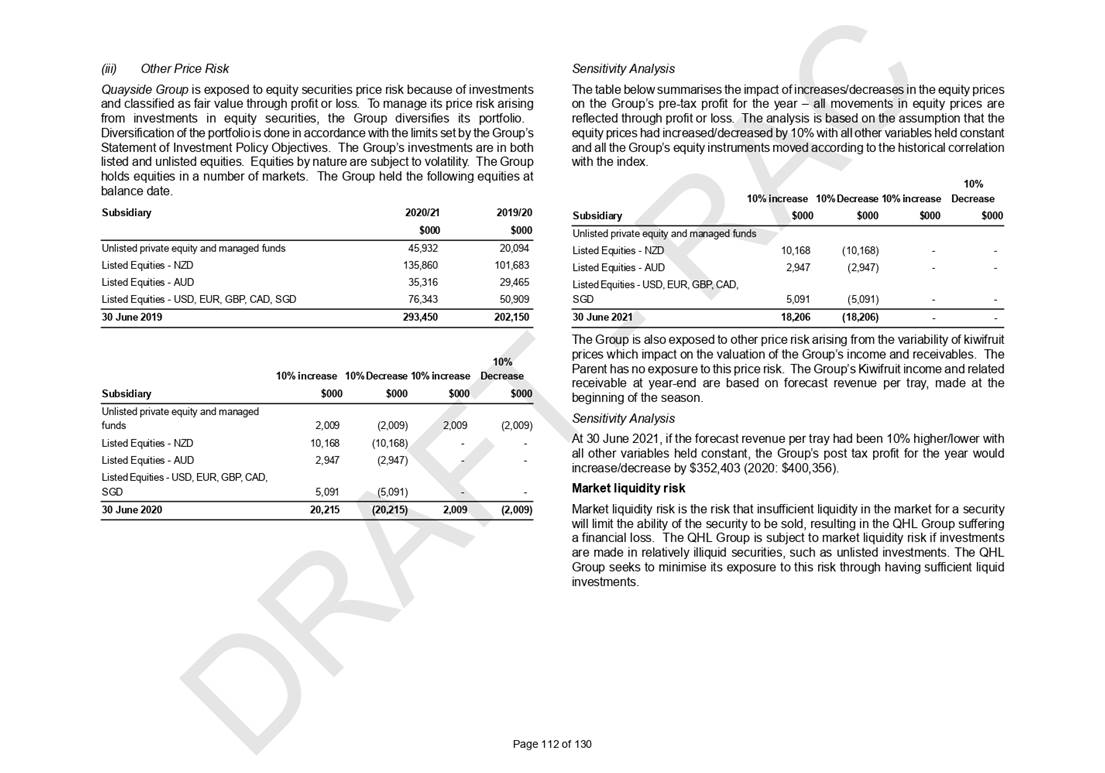
2.2.1 Operating Revenue
Draft operating
revenue for the year ended 30 June 2021 was $146.8 million, this is $10.0
million higher than budget of $136.8 million, and $8.3 million higher
than last year (2020: $138.5 million). Includes capital revenue of $14.3
million against a budget of $7.1 million. The key reasons for the variances are
identified as follows:
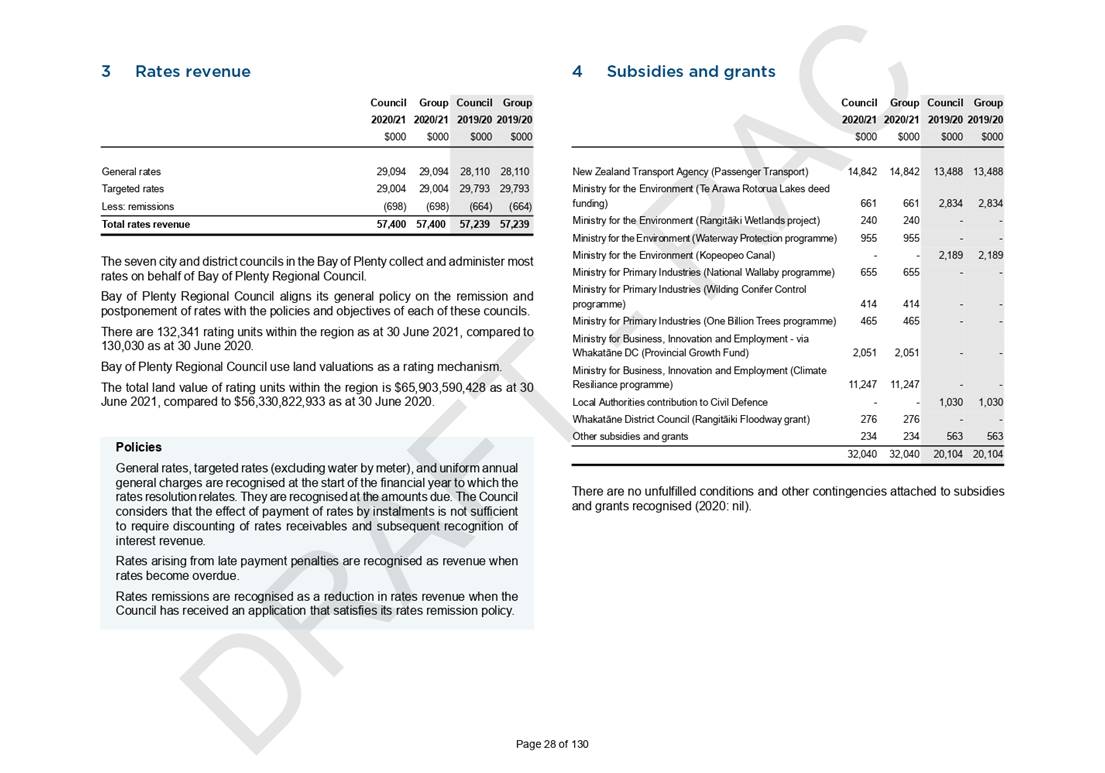
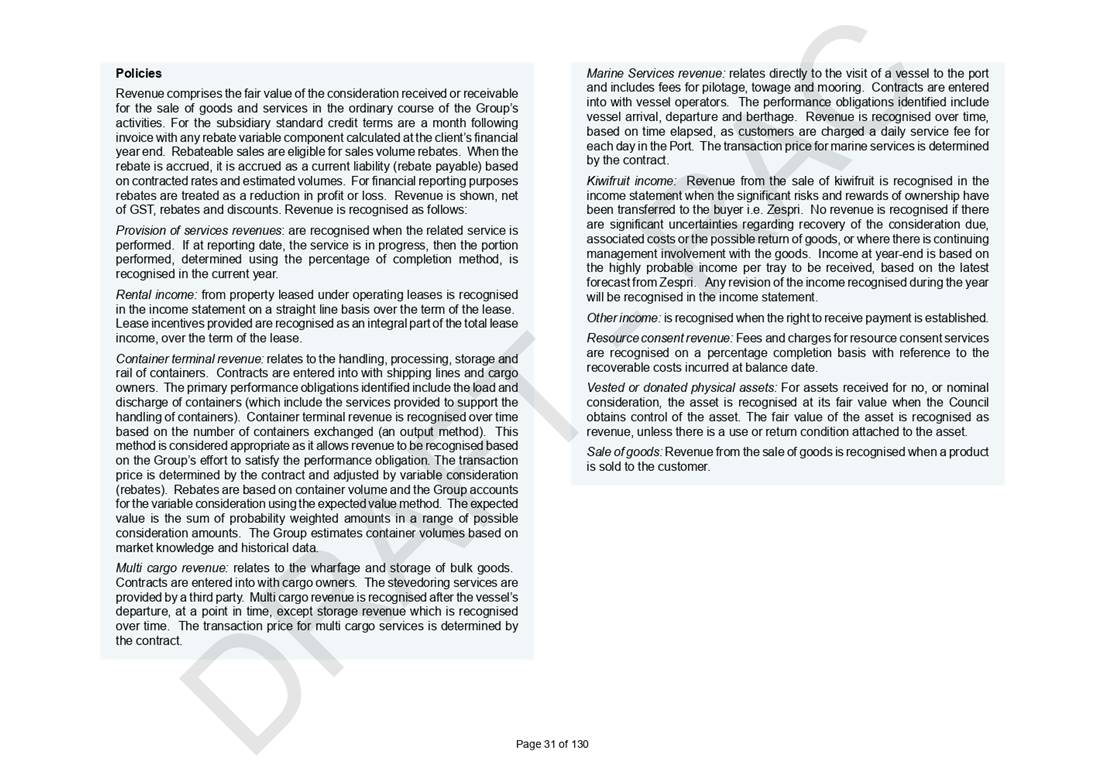
Subsidies
and grants: The most notable increases in operating
revenue came from grants and subsidies of $32 million, this result is $9.1
million higher than budget and a 60% increase on last year. Highlights include:
· Crown Infrastructure Partners funding of $11.2 million for
‘shovel ready’ and climate resilience projects in the area of flood
protection and control. We were awarded $23 million over the next four years,
significantly reducing our borrowing requirements across six capital projects.
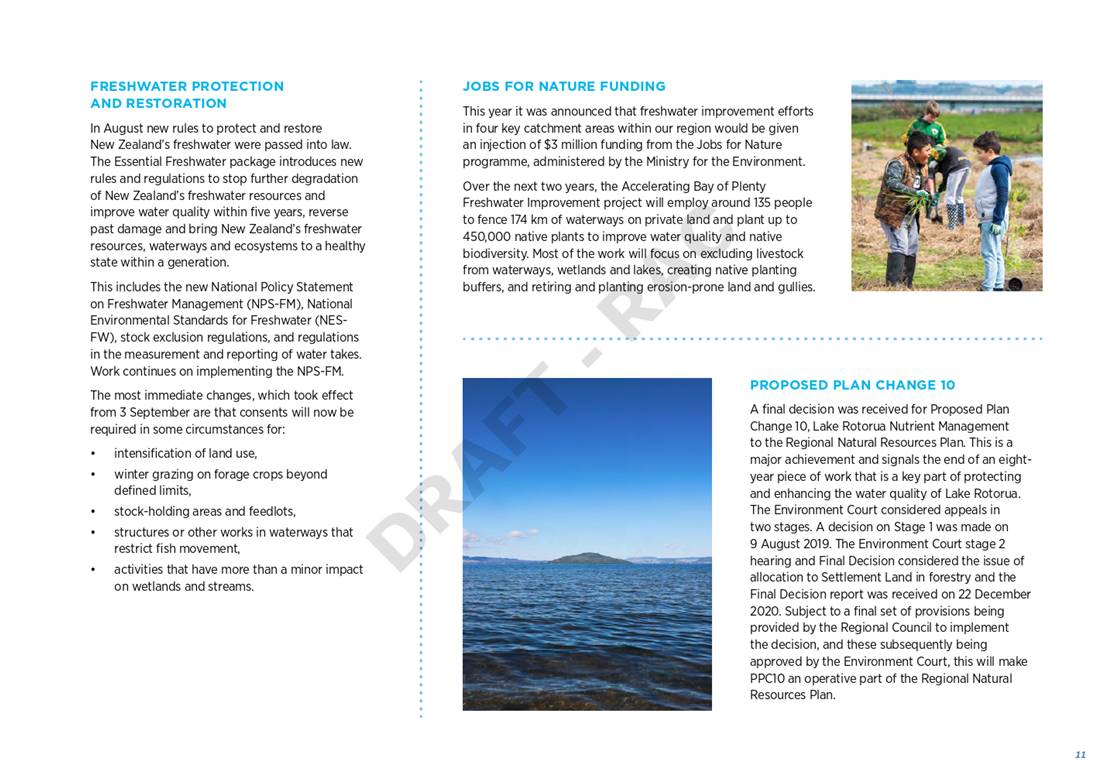
· Additional funding from the Jobs for Nature programme to improve
biosecurity, freshwater, and biodiversity in the Bay of Plenty region.
· Lower than planned grants of $2 million from the Ministry for the
Environment for the Rotorua Te Arawa Lakes enhancement programme.
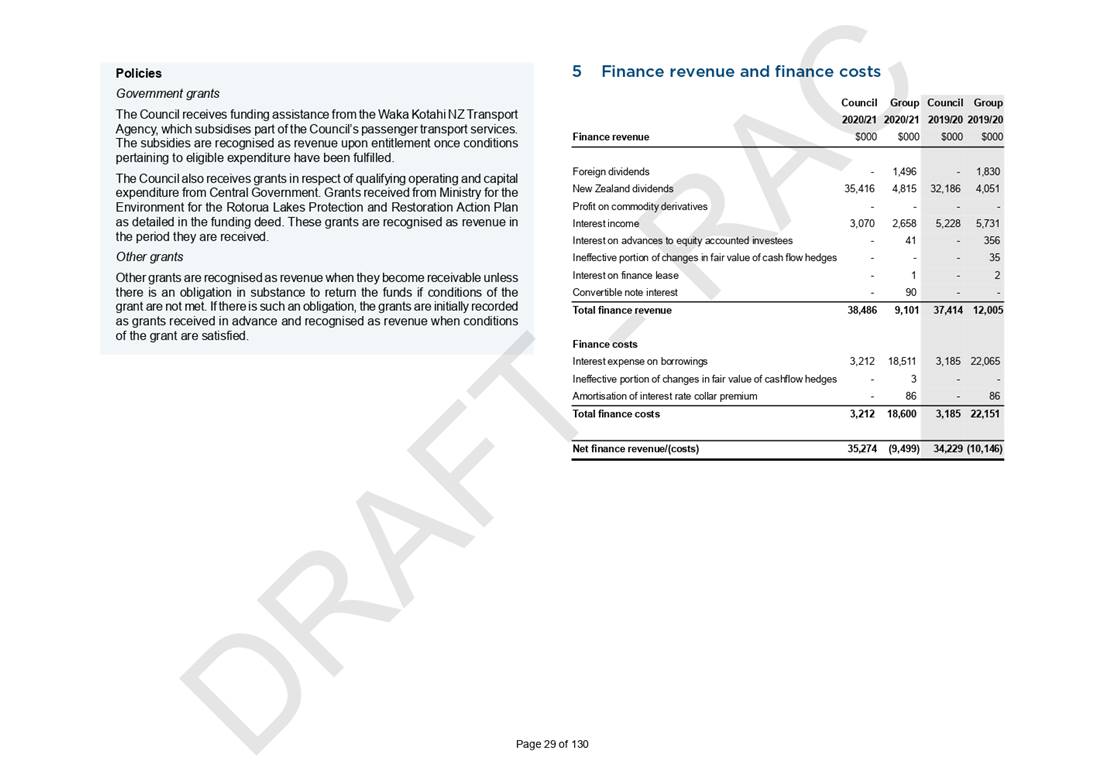
Finance
revenue: Corporate finance revenue of $38.5 million
is largely on budget, this incorporates a dividend from Quayside of $33.1
million. Toi Moana Trust paid a distribution of $2.25 million meeting its target
for 2020/21. The unfavourable variance comprises $0.5 million lower than
planned interest revenue off cash and other financial assets.
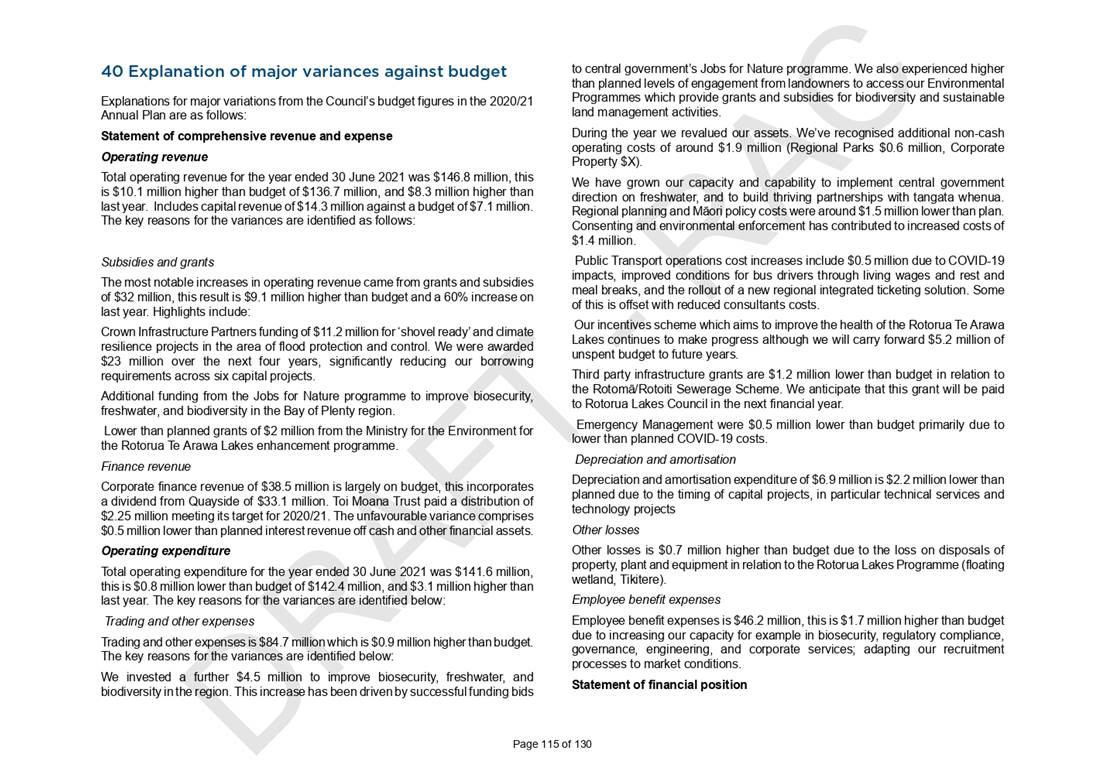
2.2.2 Operating Expenditure
Draft operating
expenditure for the year ended 30 June 2021 was $141.3 million, this is $1.1
million lower than budget of $142.4 million, and $2.8 million higher
than last year (2020: $138.5 million). The key reasons for the variances are
identified below:
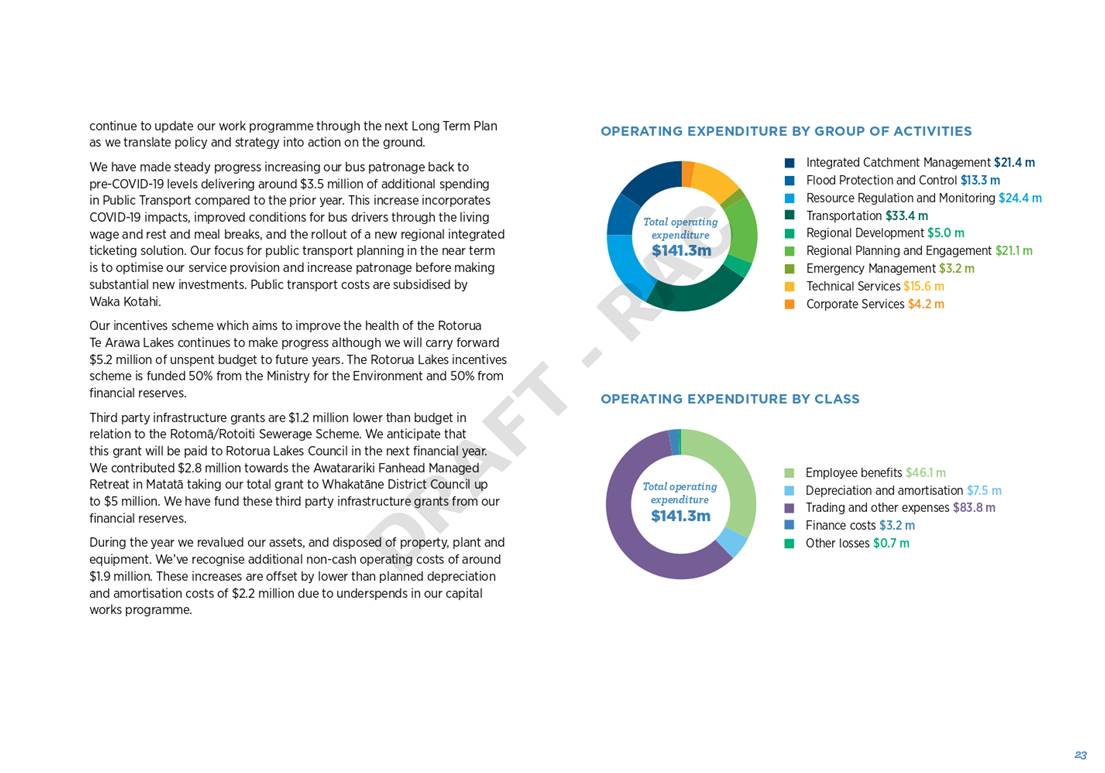
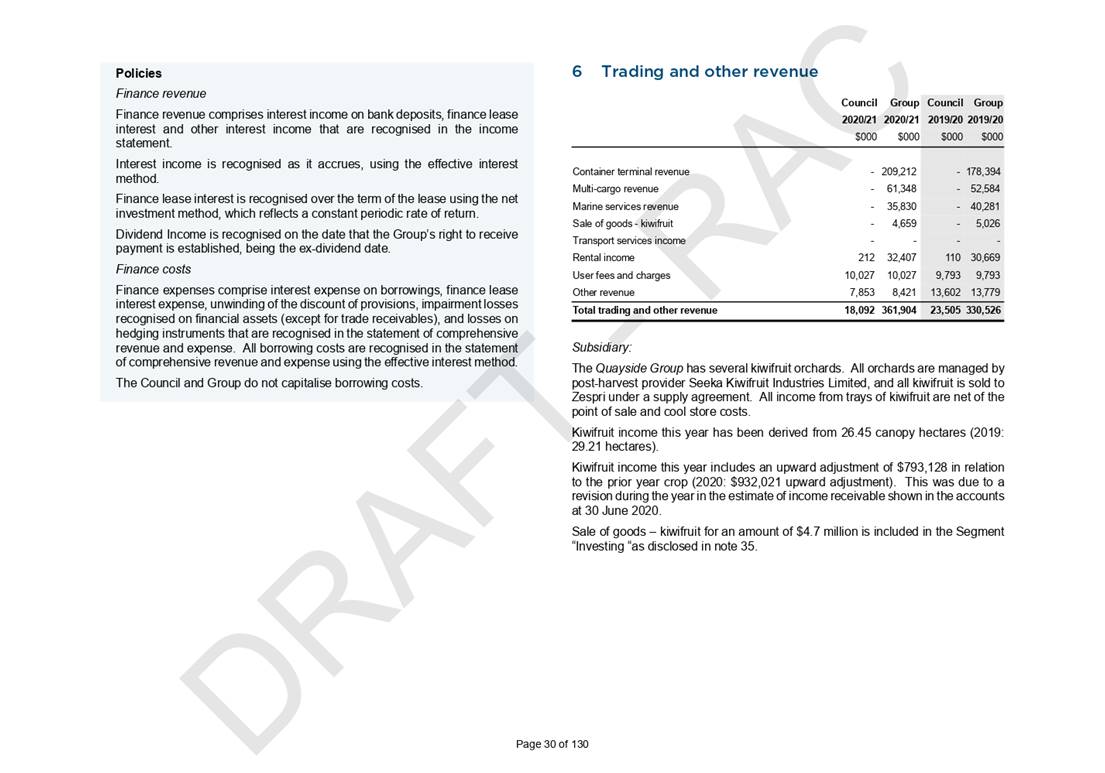
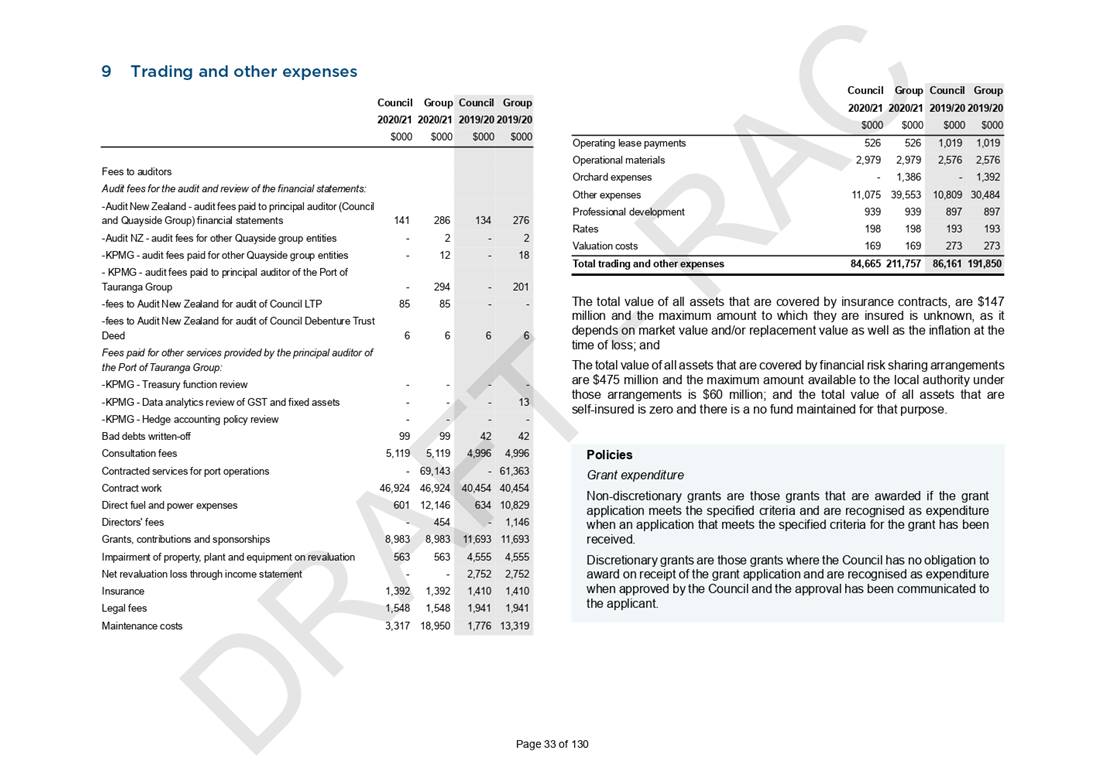
Trading and
other expenses: Trading and other expenses is $83.8
million which is $1.8 million lower than budget. The key reasons for the
variances are identified below:
· We invested a further $4.5 million to improve biosecurity,
freshwater, and biodiversity in the region. This increase has been driven by
successful funding bids to central government’s Jobs for Nature
programme.
· We also experienced higher than planned levels of engagement from
landowners to access our Environmental Programmes which provide grants and
subsidies for biodiversity and sustainable land management activities.
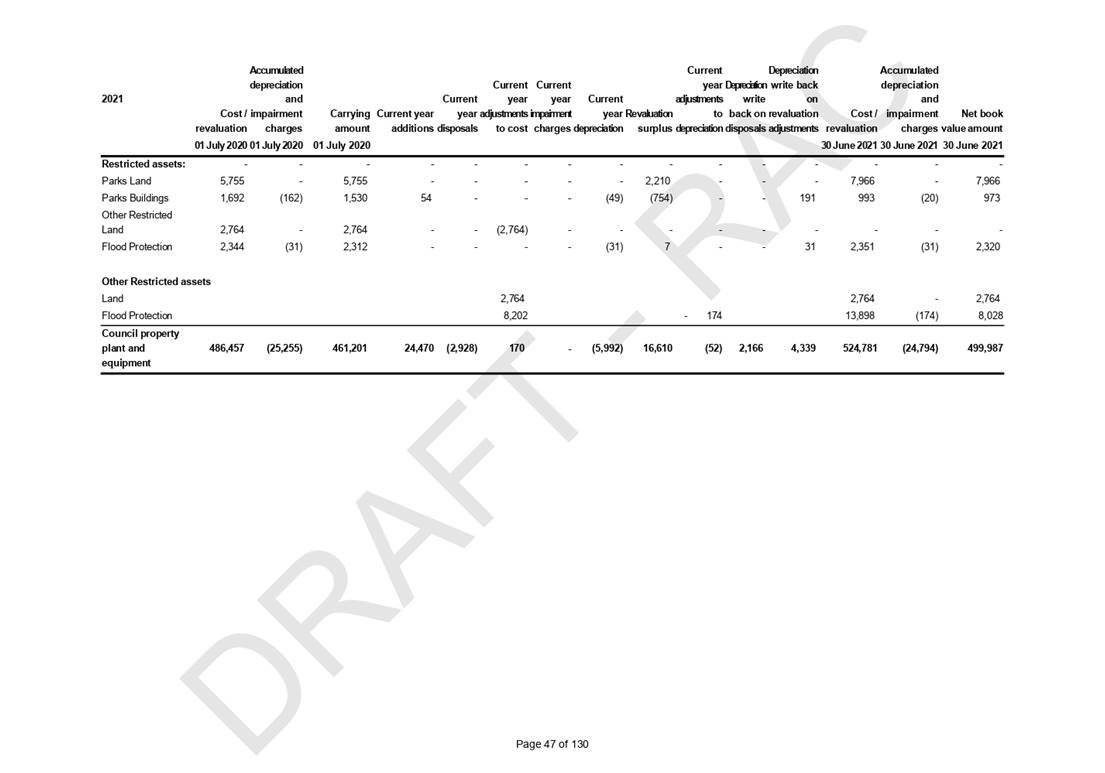
· During the year we revalued our assets. We’ve recognised
additional non-cash operating costs of around $0.6 million in relation to
Regional Parks.
· We have grown our capacity and capability to implement central
government direction on freshwater, and to build thriving partnerships with
tangata whenua. Regional planning and Māori policy costs were around $1.5
million lower than plan.
· Consenting and environmental enforcement has contributed to
increased costs of $1.4 million.
· Public Transport operations cost increases include $0.5 million due
to COVID-19 impacts, improved conditions for bus drivers through living wages
and rest and meal breaks, and the rollout of a new regional integrated
ticketing solution. Some of this is offset with reduced consultant’s
costs.
· Our incentives scheme which aims to improve the health of the
Rotorua Te Arawa Lakes continues to make progress although we will carry
forward $5.2 million of unspent budget to future years.
· Third party infrastructure grants are $1.2 million lower than
budget in relation to the Rotomā/Rotoiti Sewerage Scheme. We anticipate
that this grant will be paid to Rotorua Lakes Council in the next financial
year.
· Emergency Management were $0.5 million lower than budget
primarily due to lower than planned COVID-19 costs.
Depreciation
and amortisation: Depreciation and amortisation
expenditure of $7.5 million is $1.7 million lower than planned due to
the timing of capital projects, in particular technical services and technology
projects.
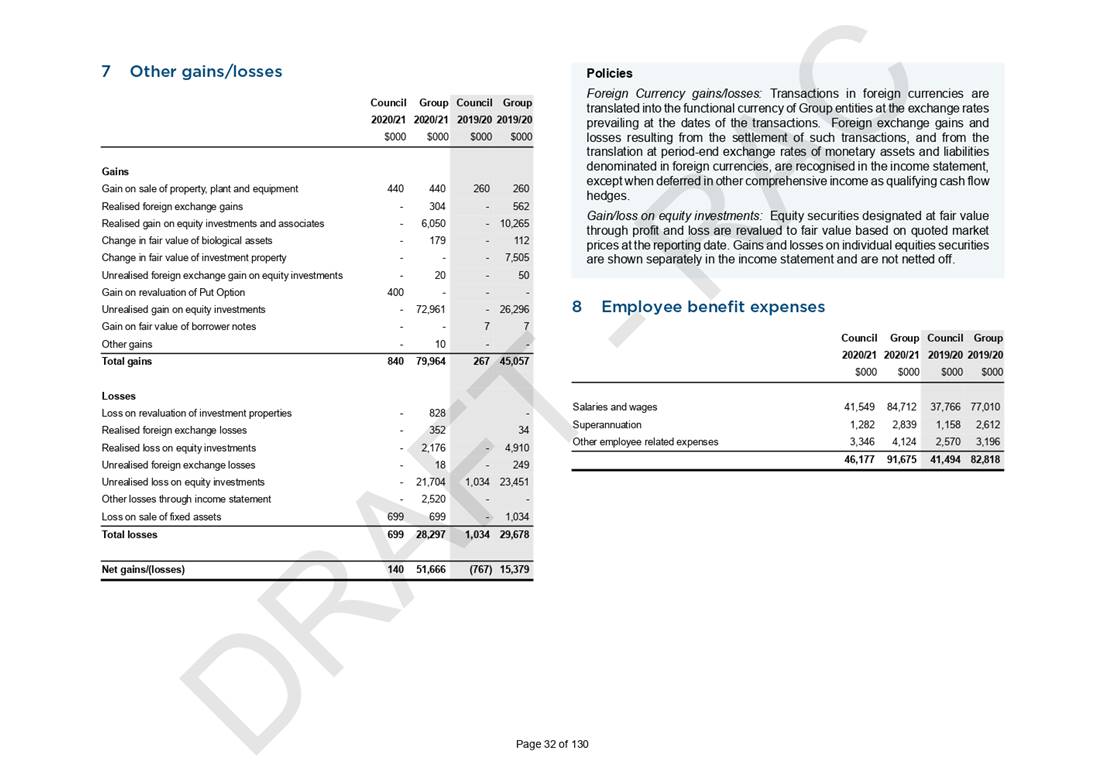
Other losses: Other losses is $0.7 million higher than budget due to the
loss on disposals of property, plant and equipment in relation to the Rotorua
Lakes Programme (floating wetland, Tikitere).
Employee
benefit expenses: Employee benefit expenses is
$46.1 million, this is $1.7 million higher than budget due to increasing
our capacity for example in biosecurity, regulatory compliance, governance,
engineering, and corporate services; adapting our recruitment processes to
market conditions.
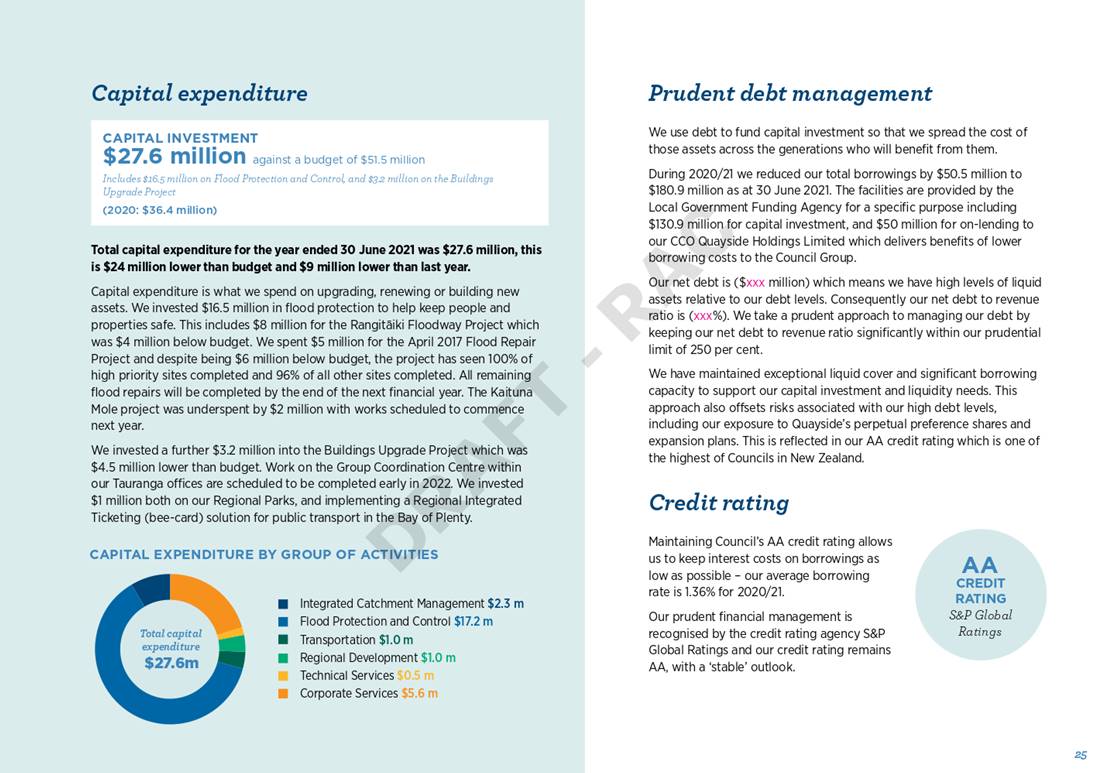
2.2.3 Capital Expenditure
Draft capital
expenditure for the year ended 30 June 2021 was $27.6 million, this is $24
million lower than budget and $9 million lower than last year
(2020: $36.4 million).
We invested
$16.5 million in flood protection to help keep people and properties safe. This
includes $8 million for the Rangitāiki Floodway Project which was $4
million lower than budget.
We spent $5
million for the April 2017 Flood Repair Project and despite being $6 million
below budget, the project has seen 100% of high priority sites completed and
96% of all other sites completed. All remaining flood repairs will be completed
by the end of the next financial year.
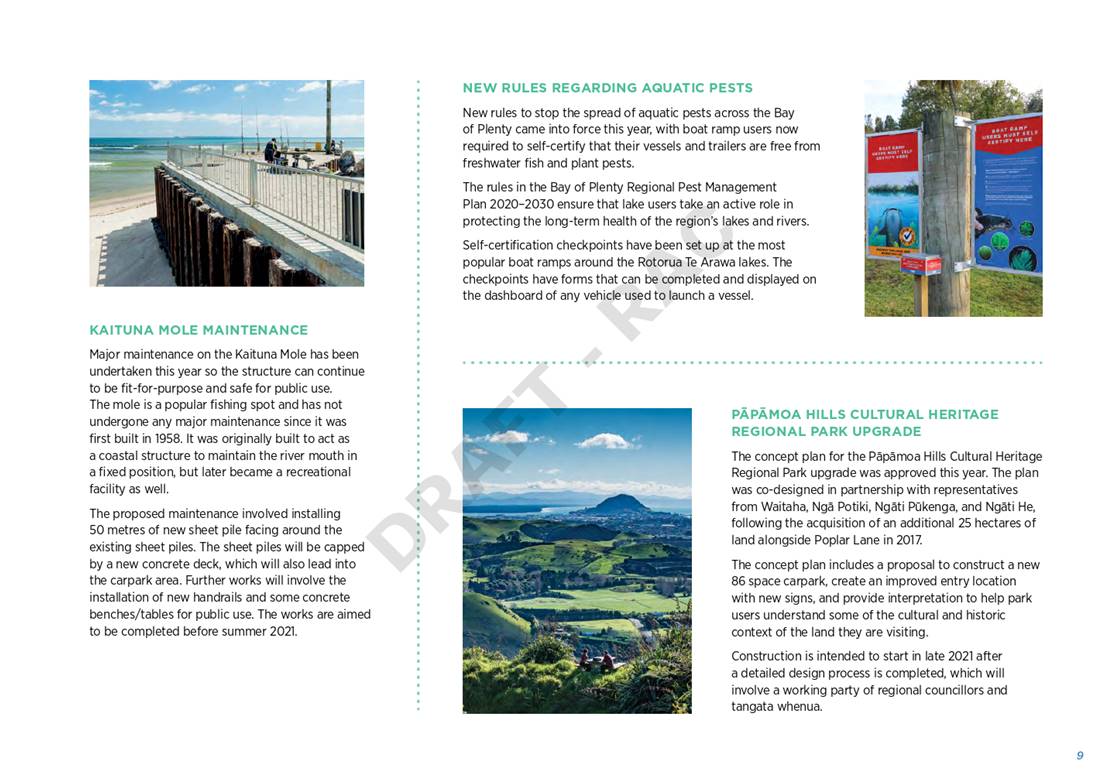
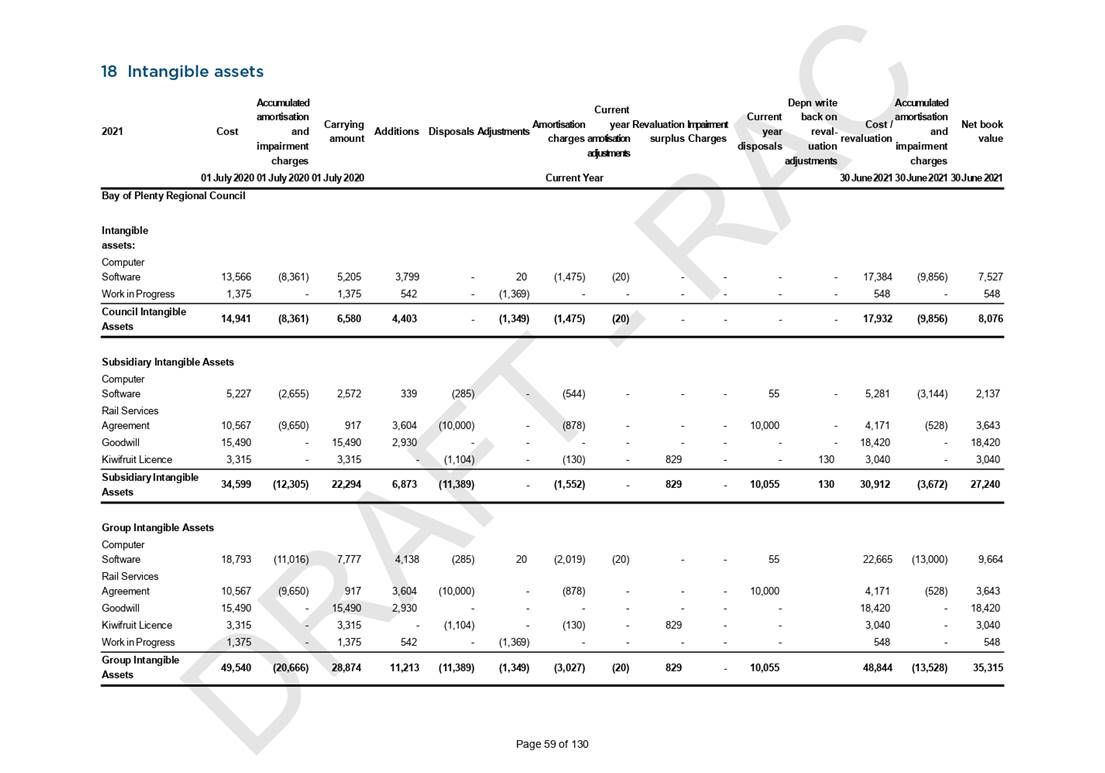
The Kaituna
Mole project was underspent by $2 million with works scheduled to commence next
year.
We invested a
further $3.2 million into the Buildings Upgrade Project which was $4.5 million lower
than budget. Work on the Group Coordination Centre within our Tauranga offices
are scheduled to be completed early in 2022.
We invested $1
million both on our Regional Parks, and implementing a Regional Integrated
Ticketing (bee-card) solution for public transport in the Bay of Plenty.
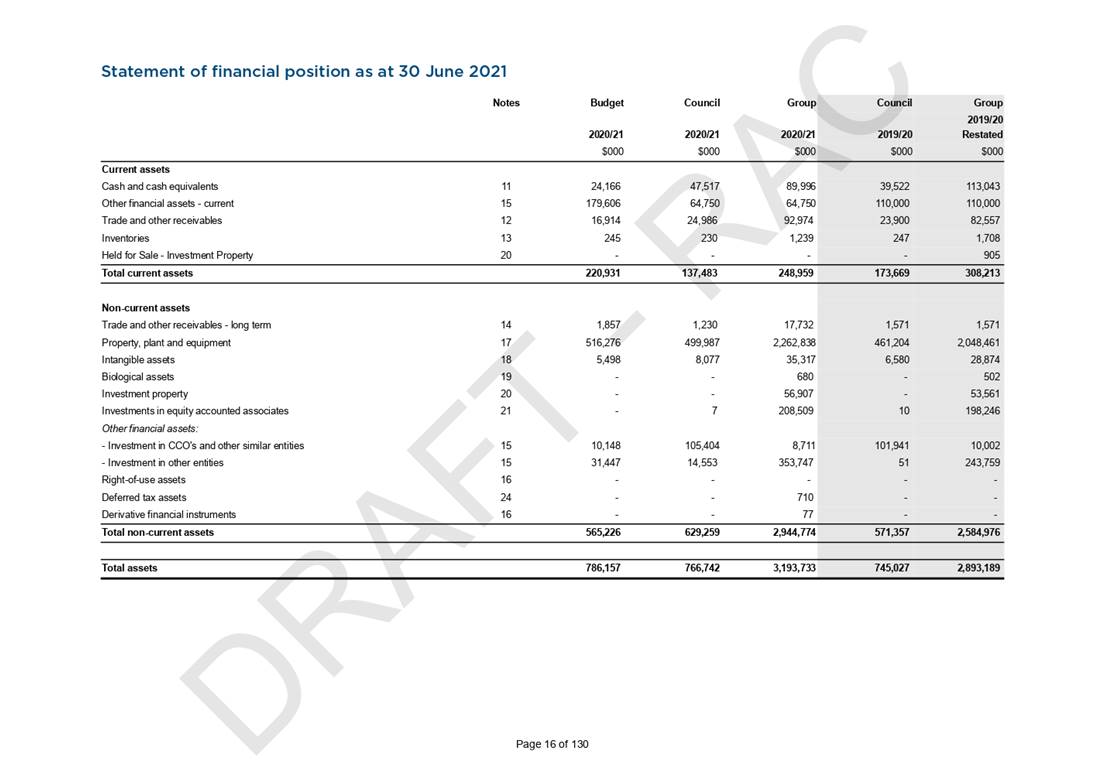
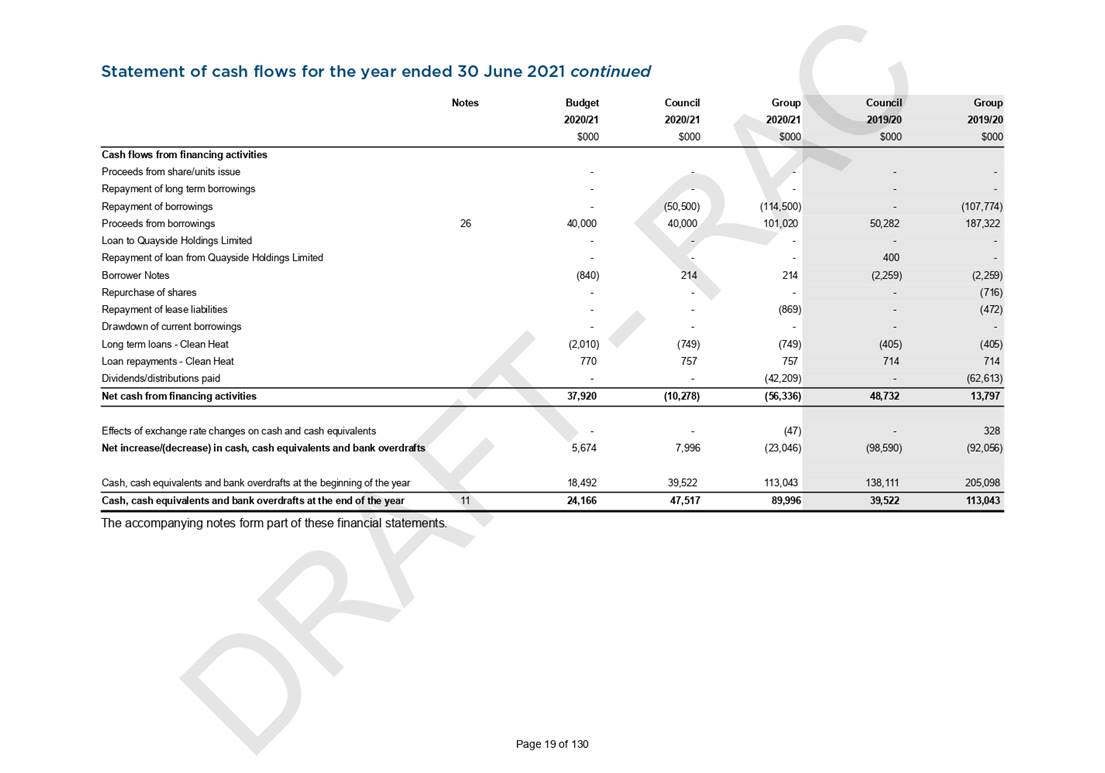
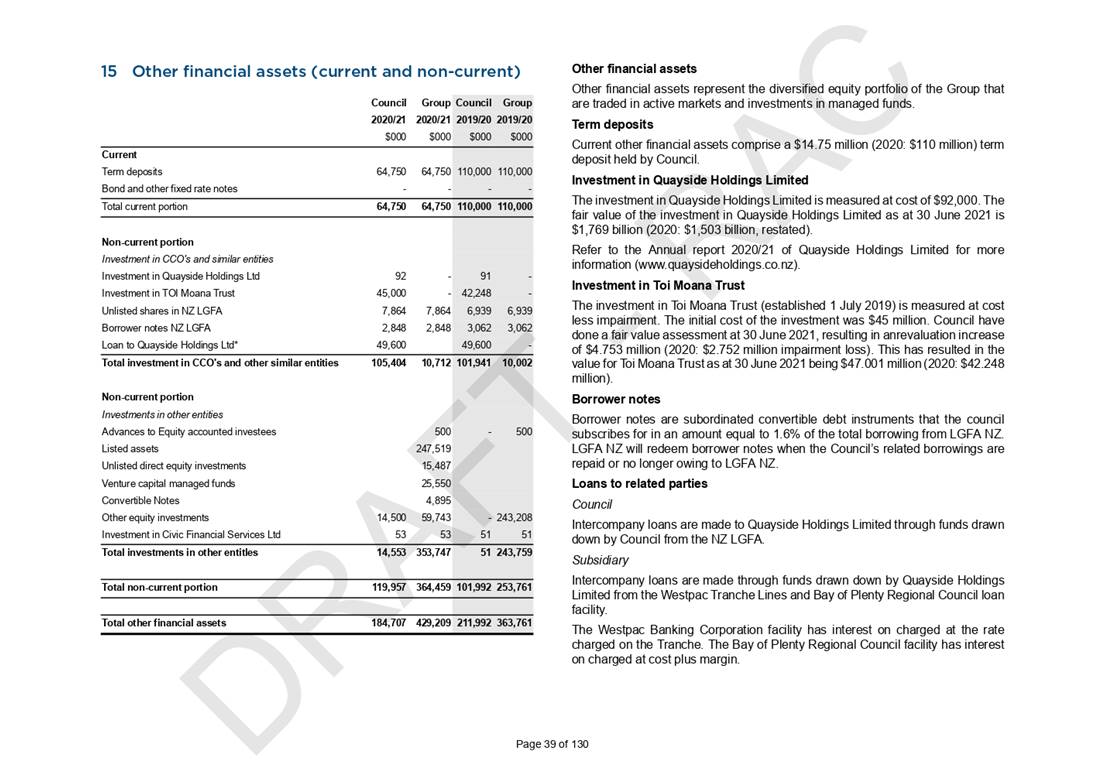
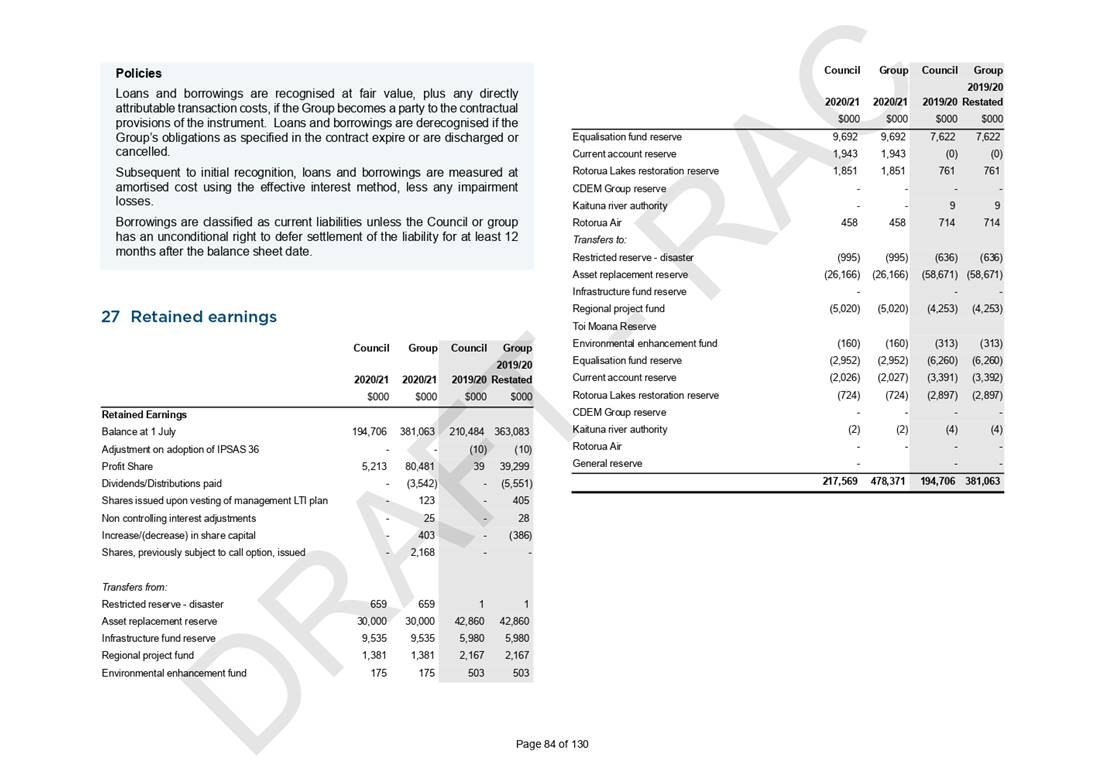
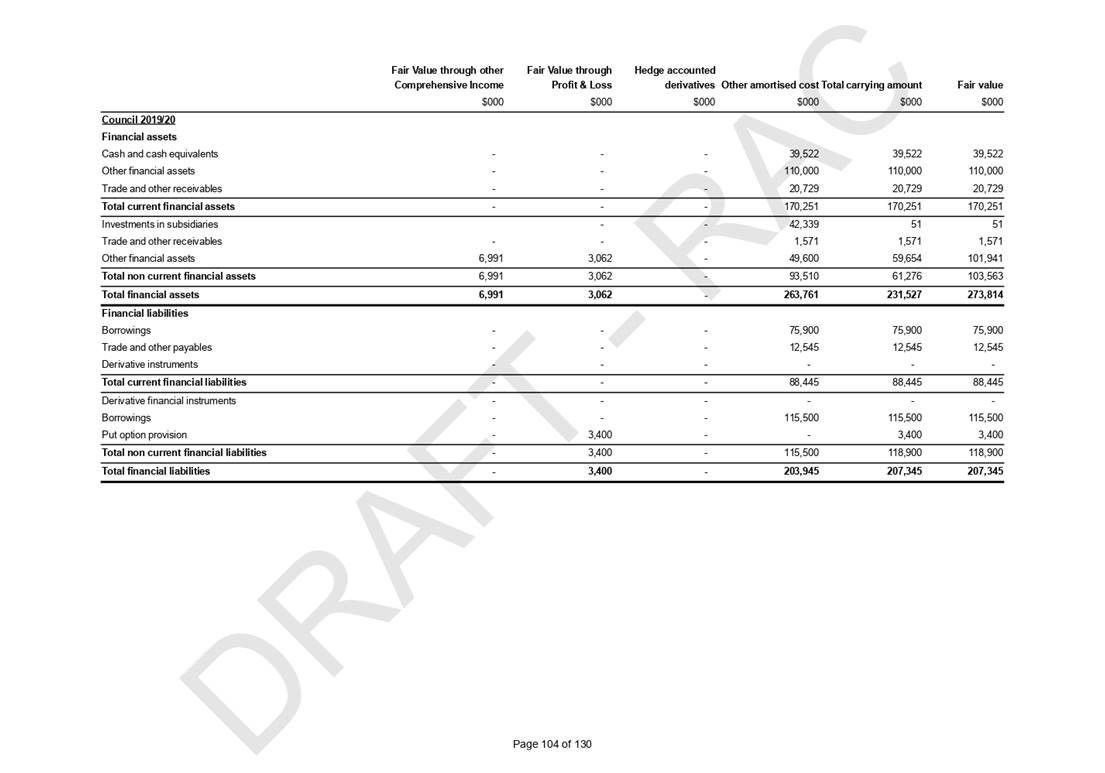
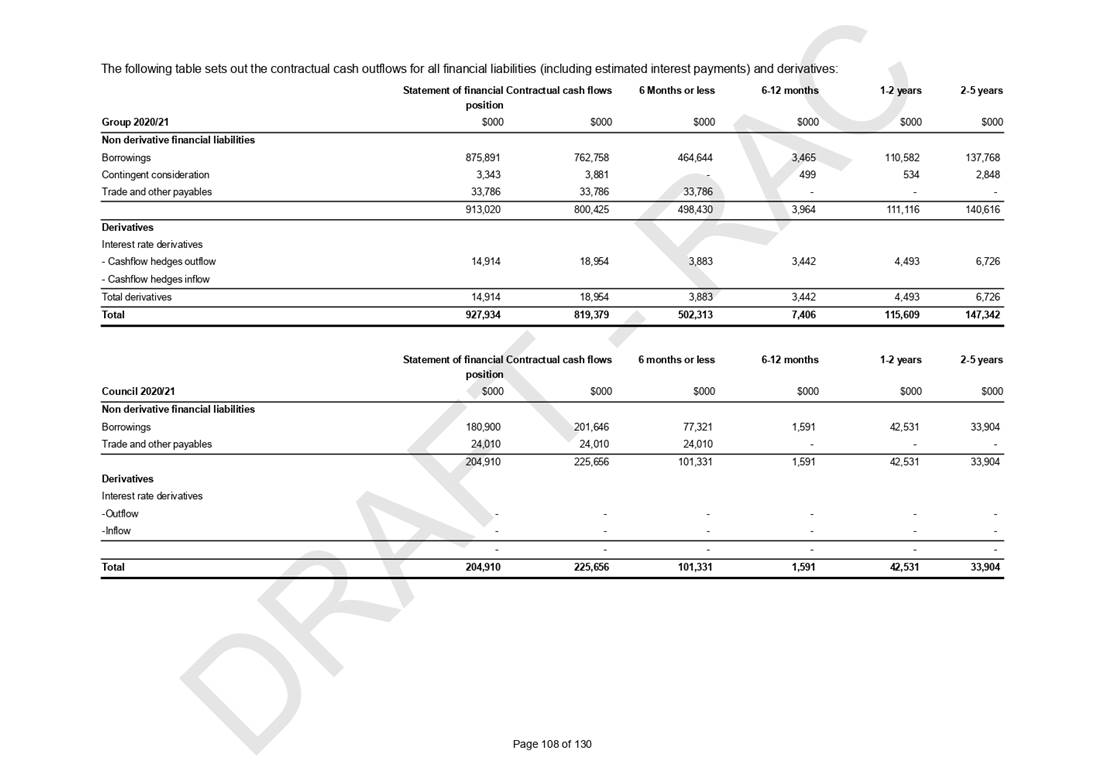
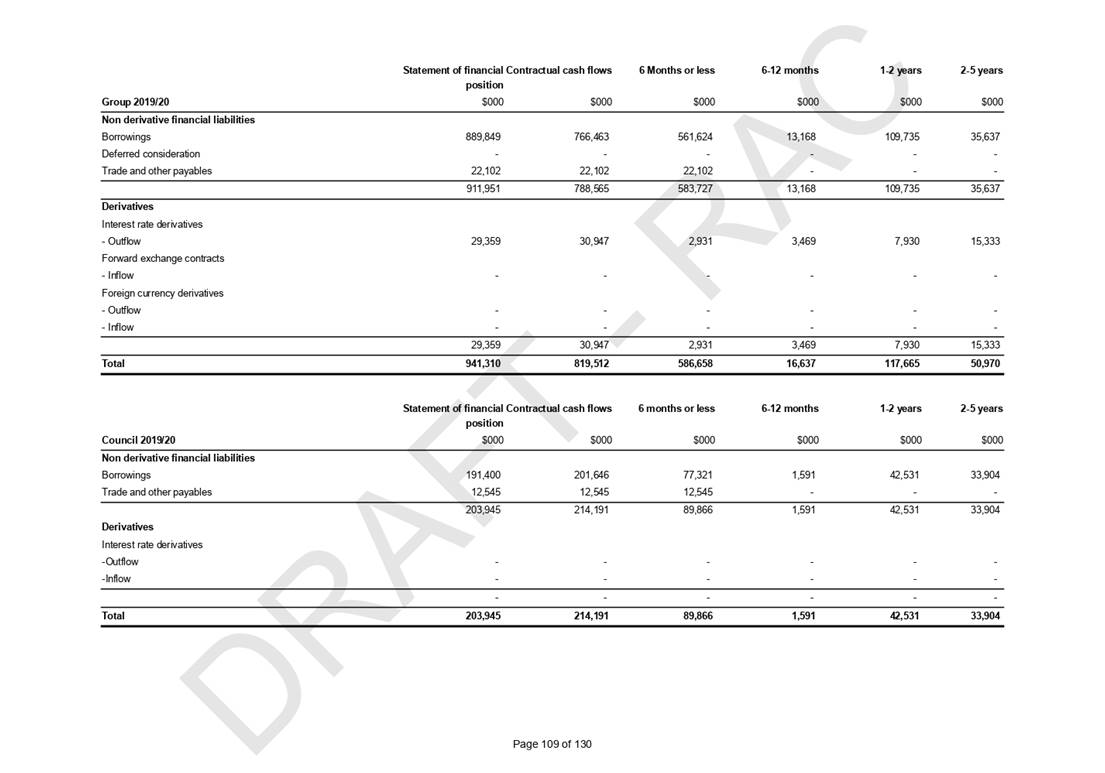
2.2.4 Treasury
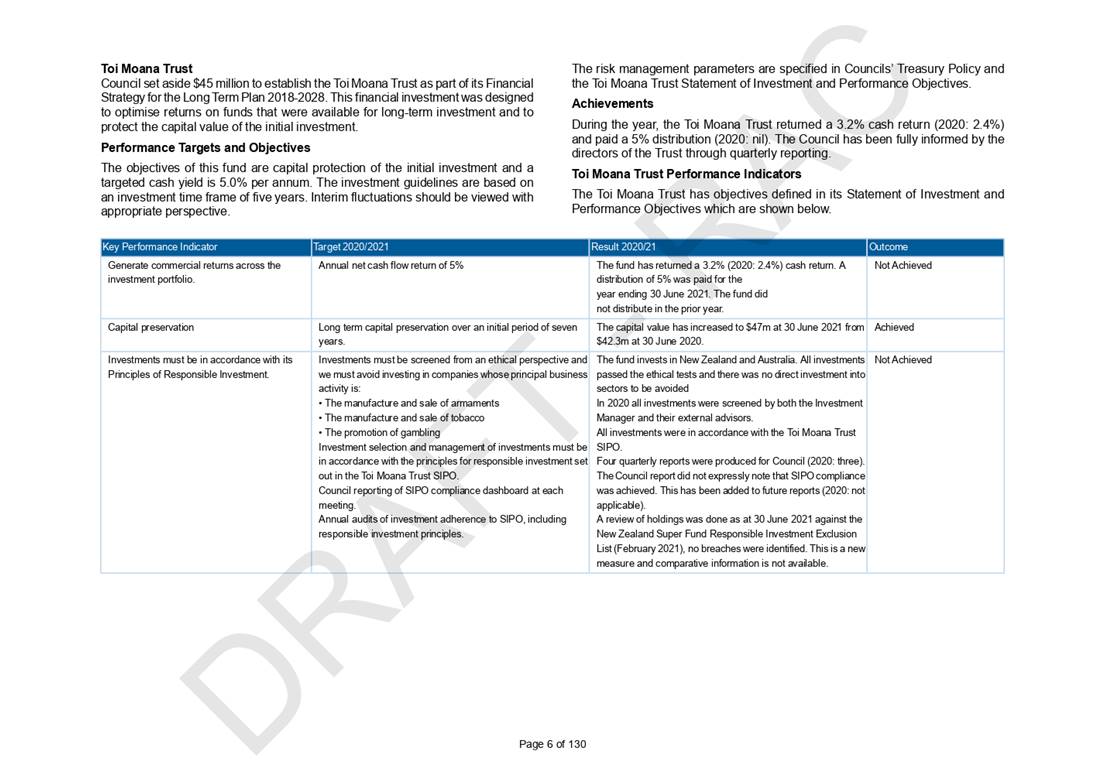
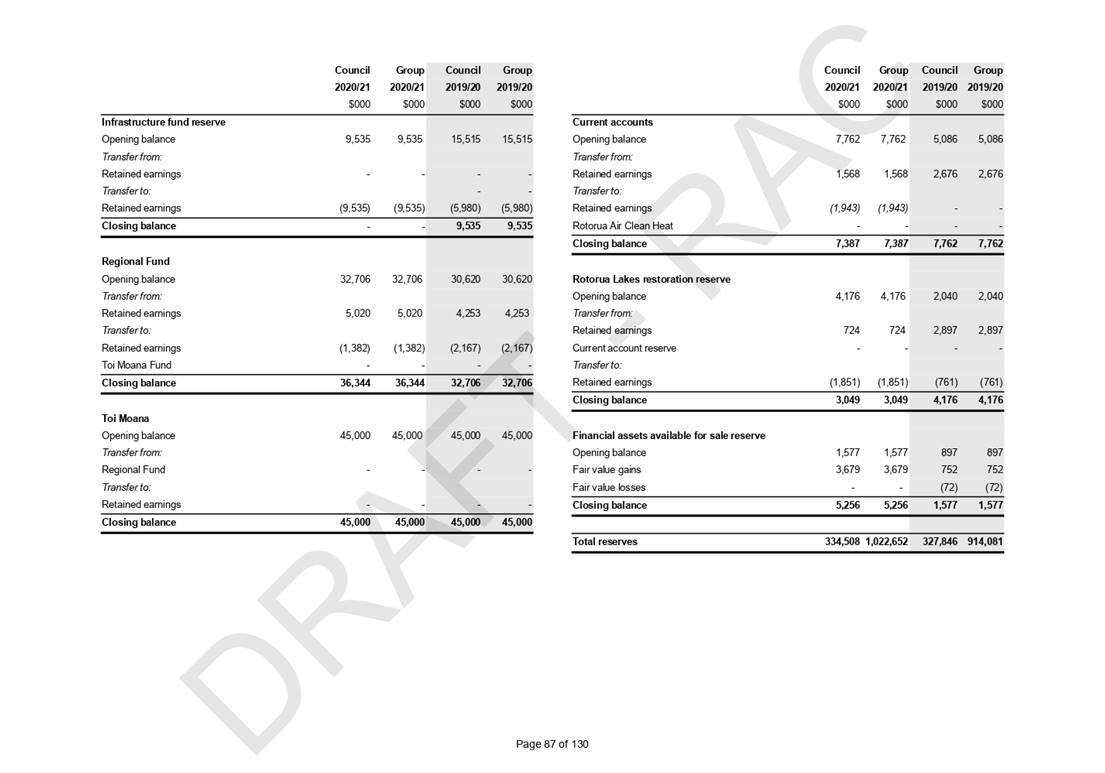
We are
recording total investments of $232.2 million (cash, cash equivalents
and other financial assets) which includes approximately $50 million on-lent to
Quayside. The $45 million Toi Moana Fund was transferred to Quayside on 1 July
2019. These funds are primarily attributed to general and restricted reserves,
as well as unspent funds borrowed from the LGFA to pre-fund capital expenditure
in advance.
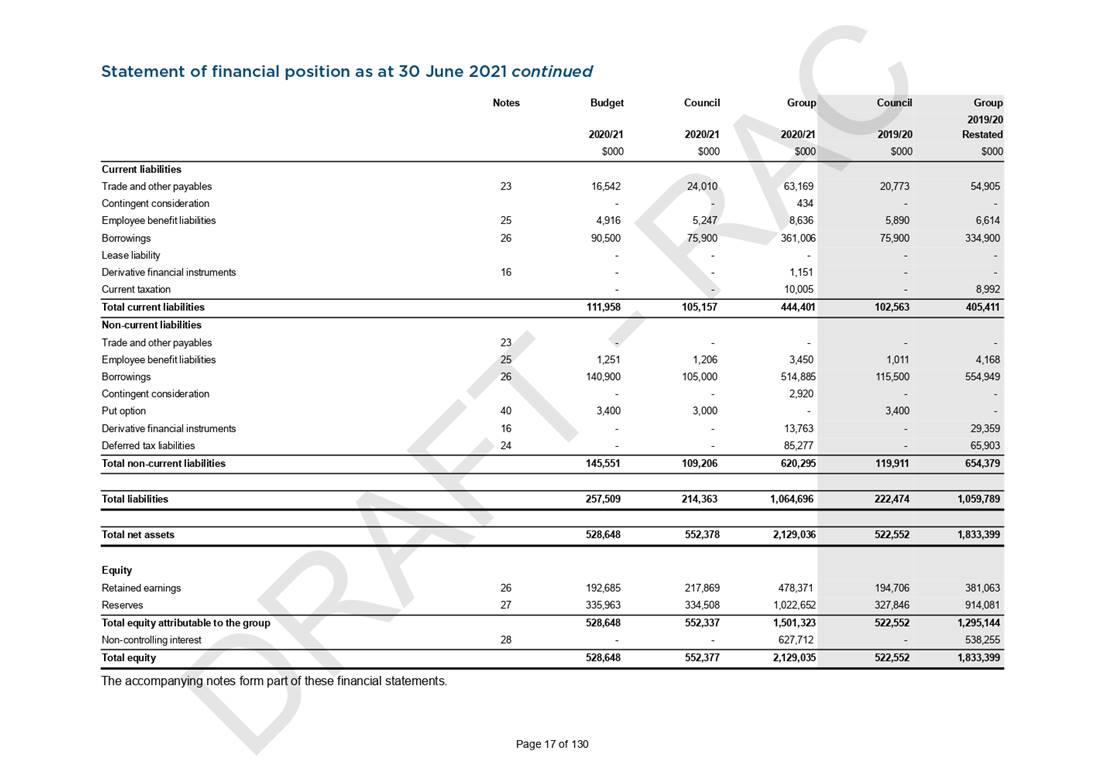
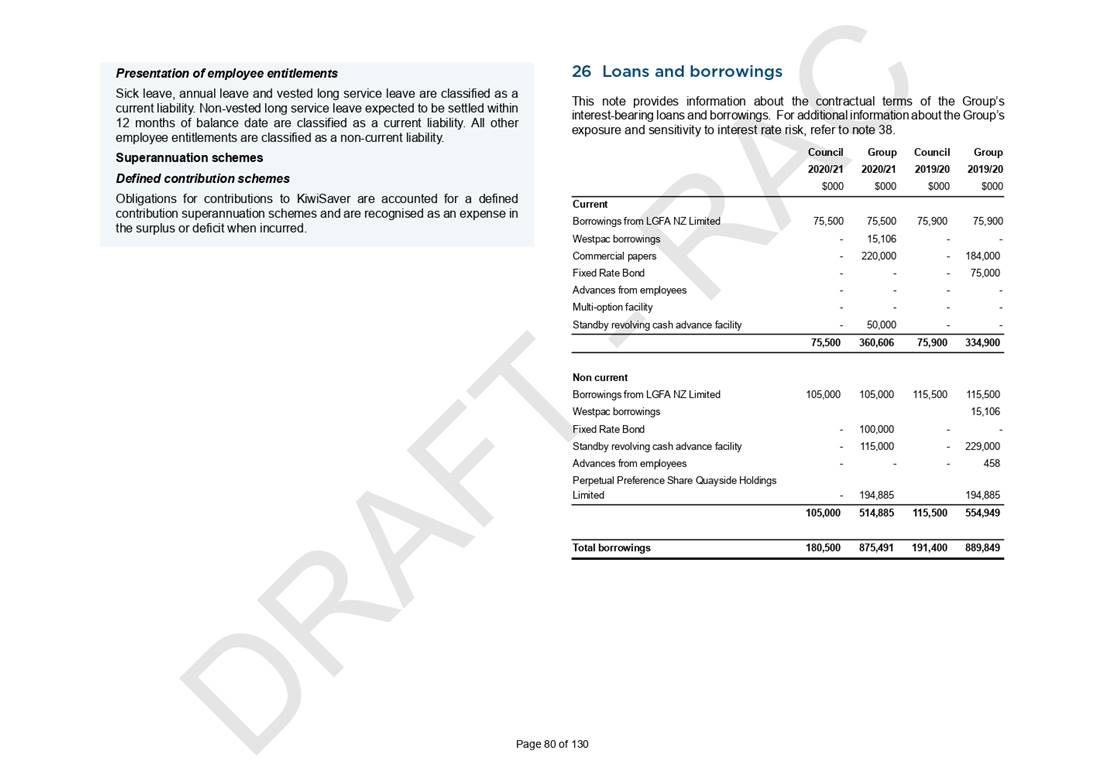
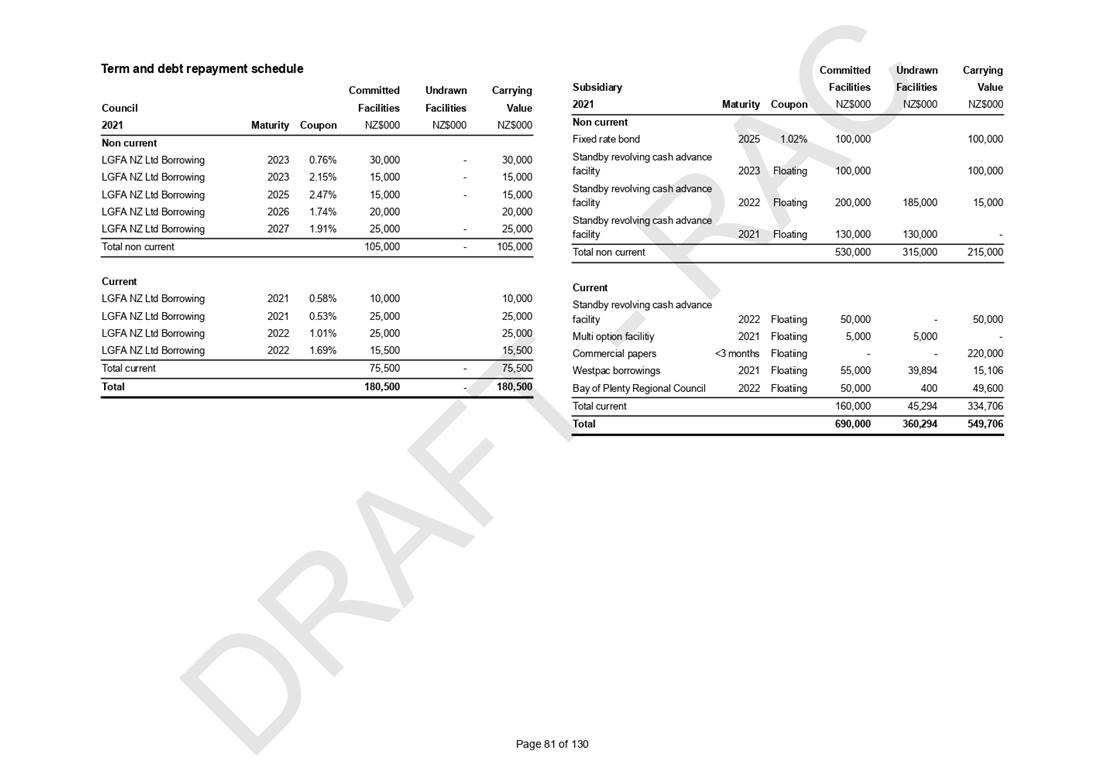
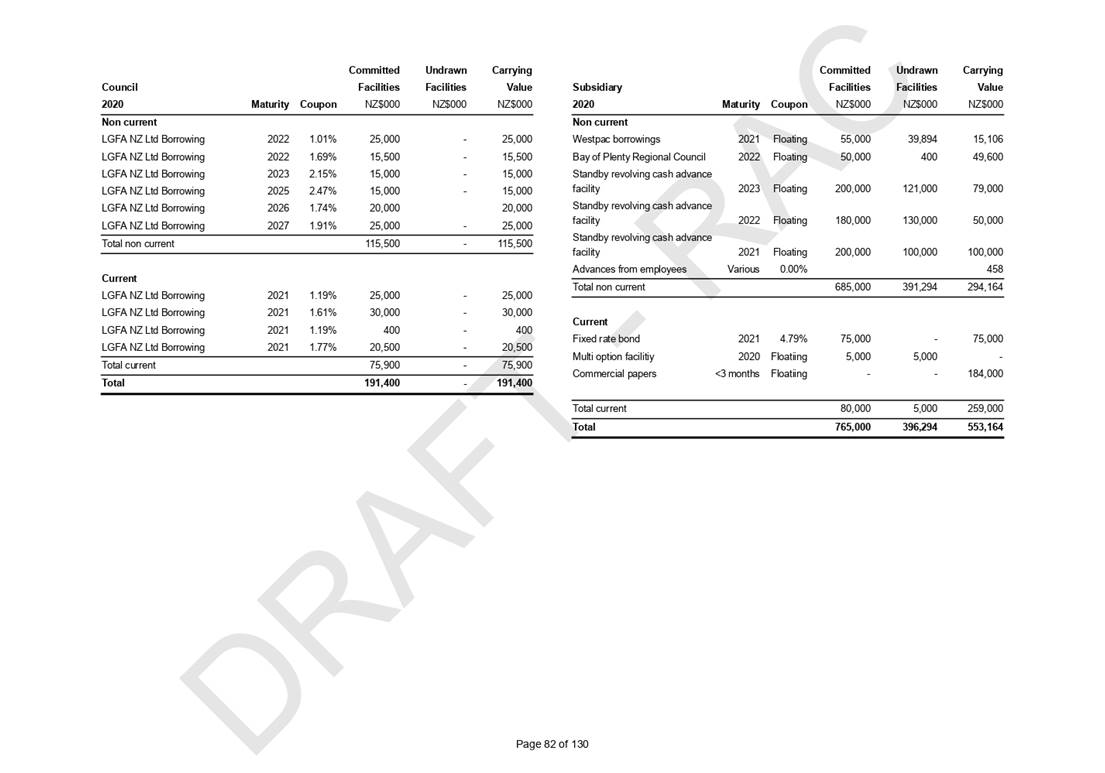
During 2020/21
we reduced our total borrowings by $50.5 million to $180.9 million as at
30 June 2021. The facilities are provided by the Local Government Funding
Agency for a specific purpose including $130.9 million for capital investment
across multiple years of the Long Term Plan 2018-2028 of which $91.7 million is
core debt, and approximately $50 million for on-lending to our CCO Quayside
Holdings Limited which delivers benefits of lower borrowing costs to the Council
Group. The average cost of debt at 30 June 2021 is 1.36%.
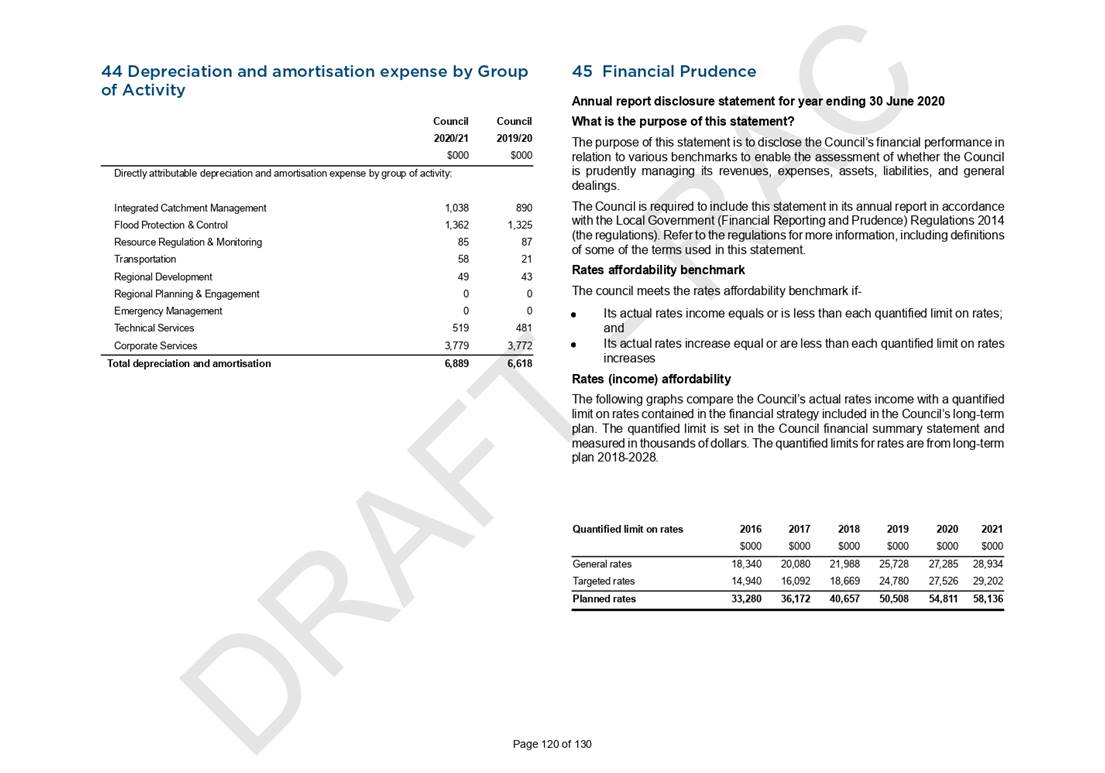
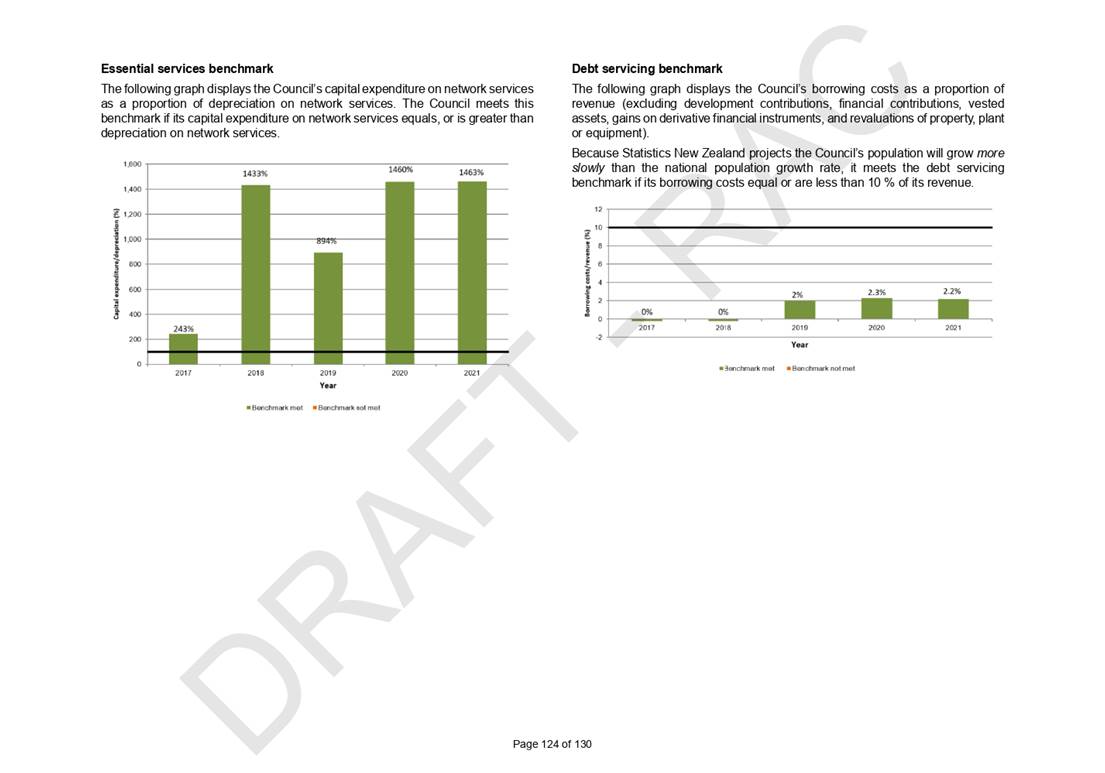
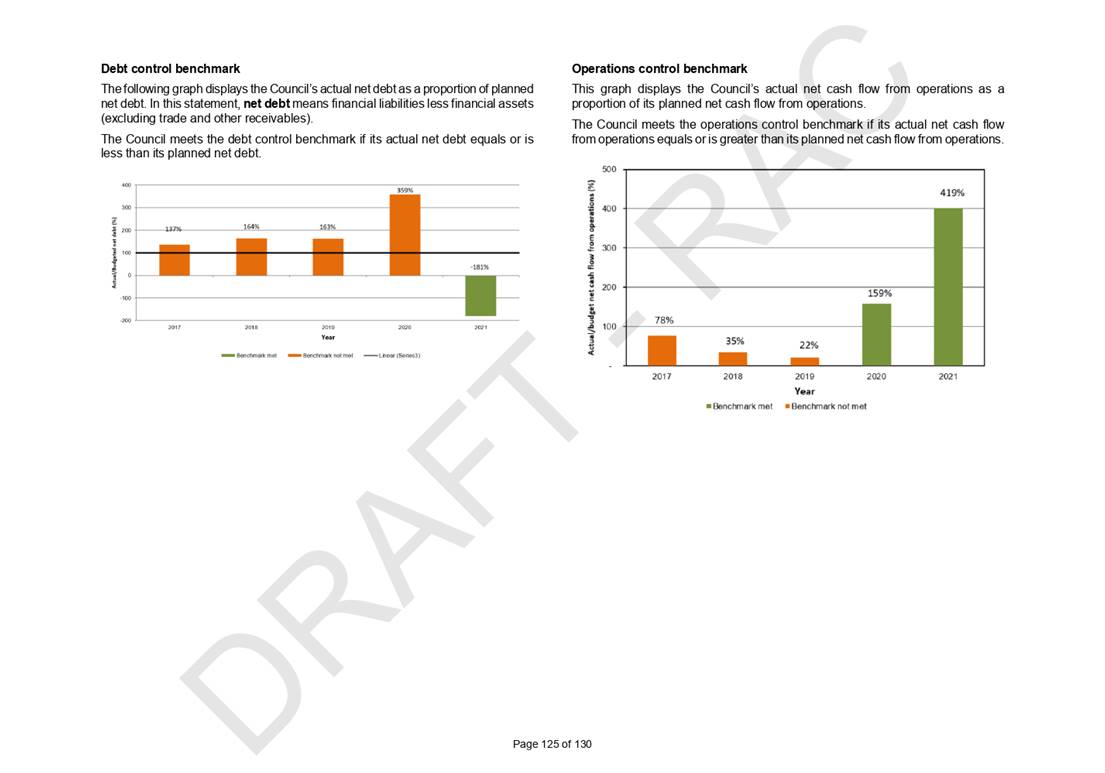
Our net debt is
($21 million) which means we have high levels of liquid assets relative to our
debt levels. Consequently our net debt to revenue ratio is (14%).
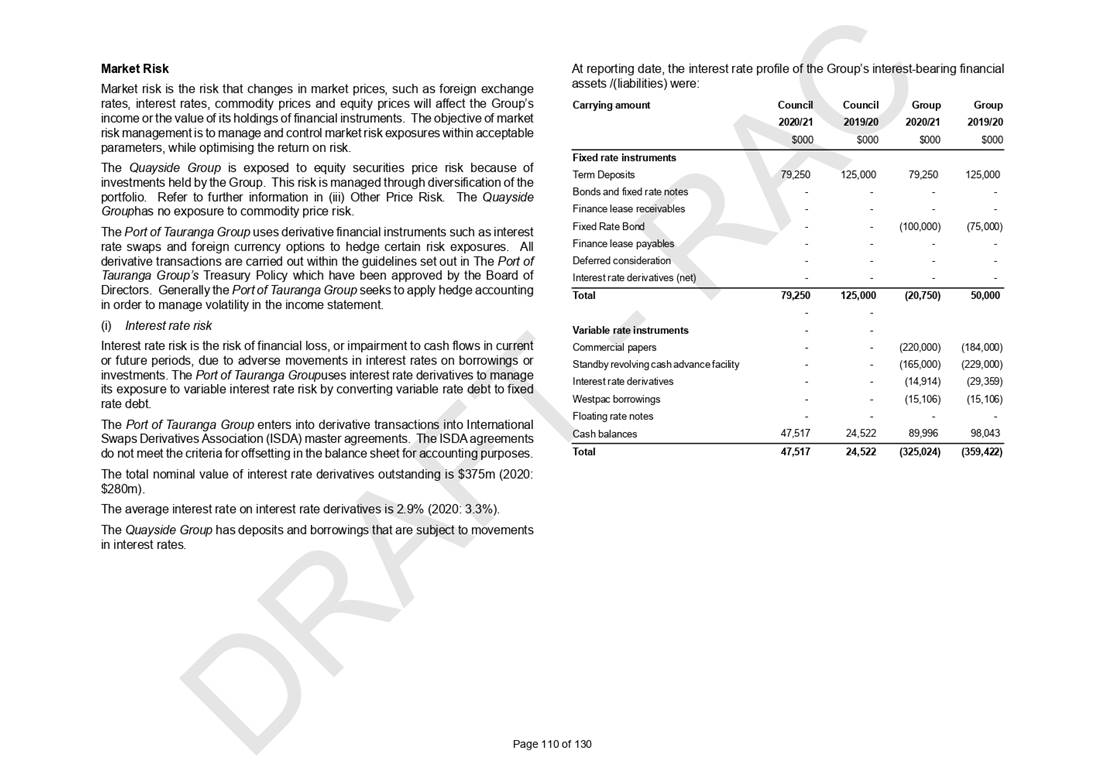
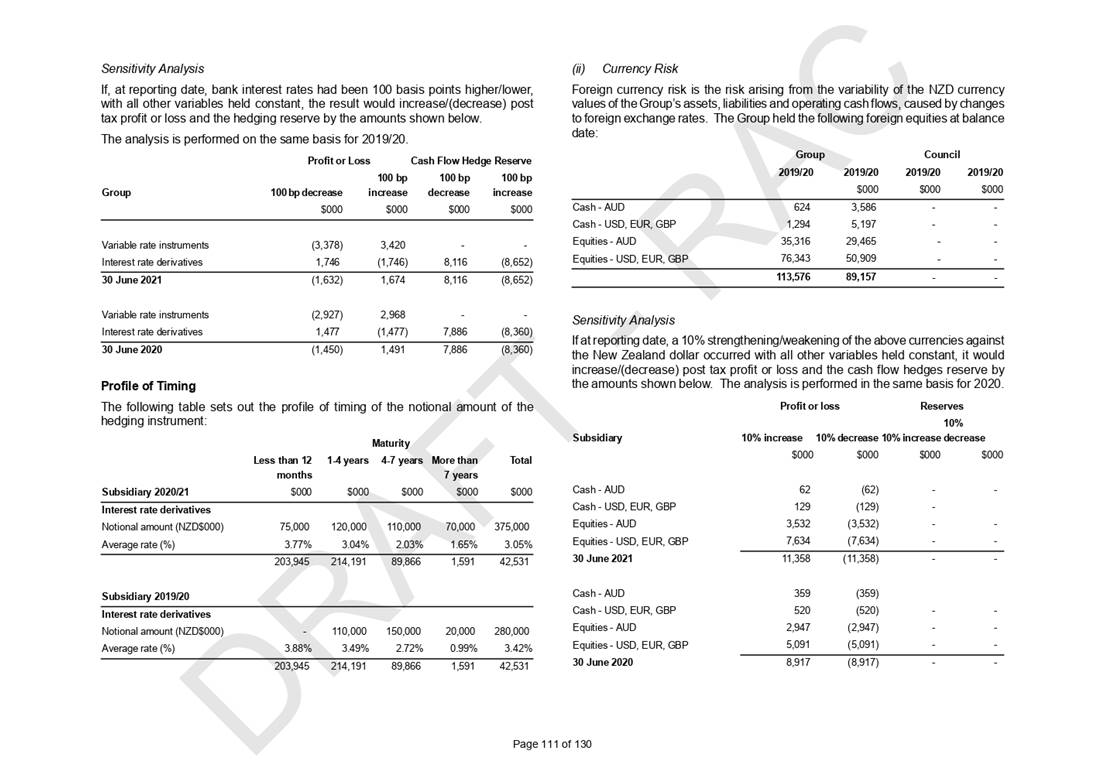
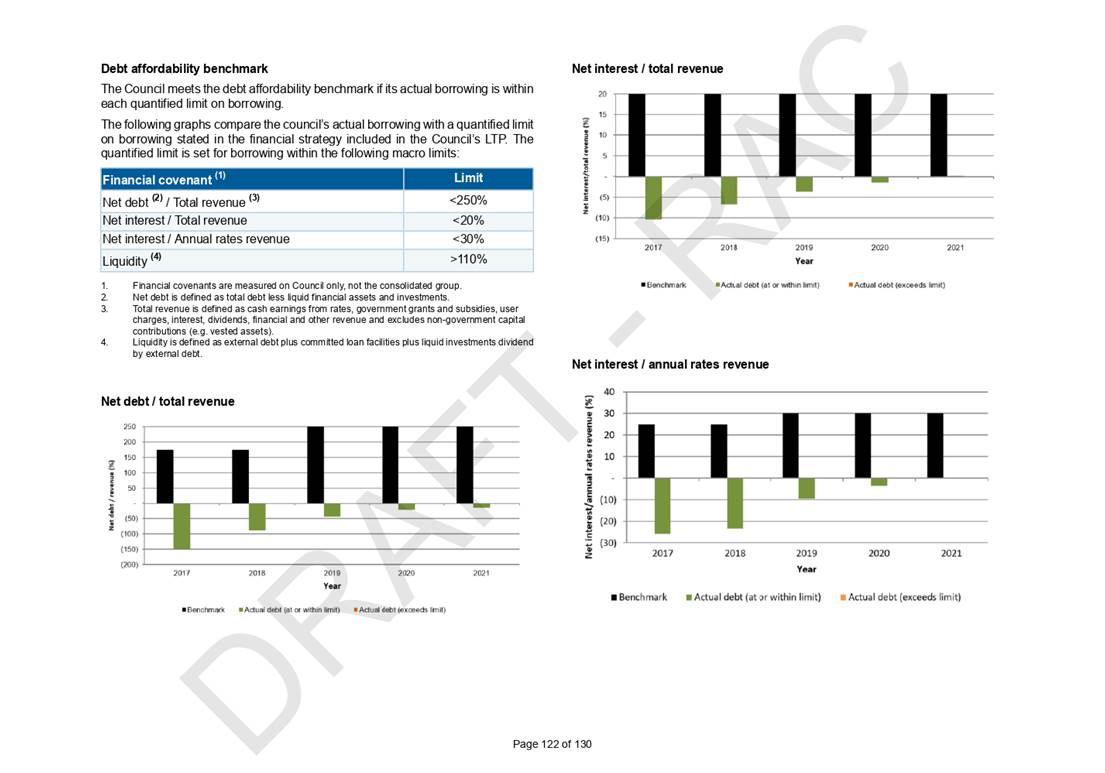
We take a
prudent approach to managing our debt by keeping our net debt to revenue ratio
significantly within our prudential limit of 250 per cent.
We have
maintained exceptional liquid cover and significant borrowing capacity to
support our capital investment and liquidity needs. This approach also offsets
risks associated with our high debt levels, including our exposure to
Quayside’s perpetual preference shares and expansion plans. This is
reflected in our AA credit rating which is one of the highest of Councils in
New Zealand.
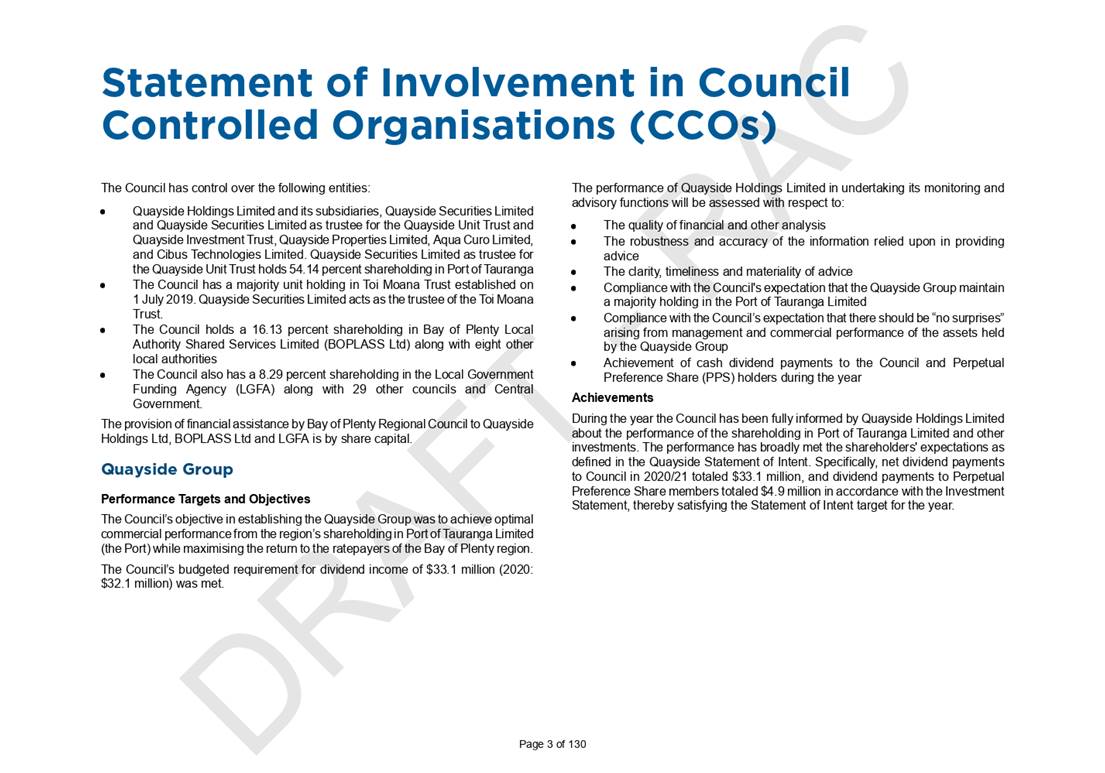
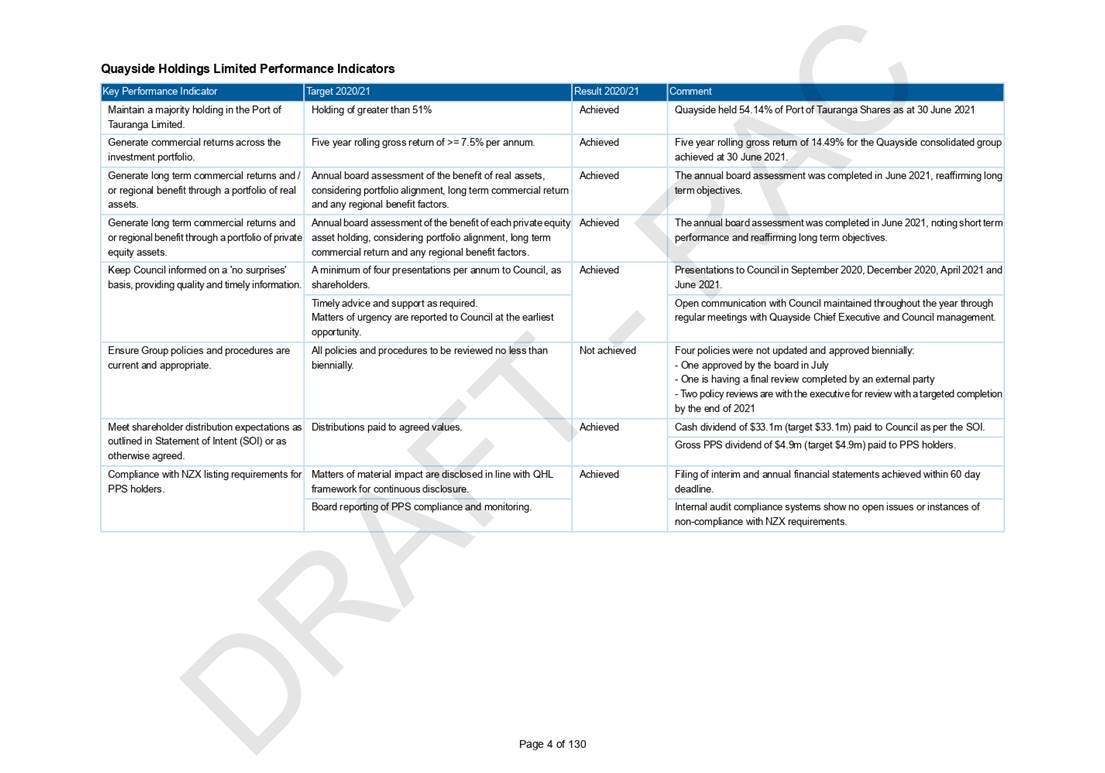
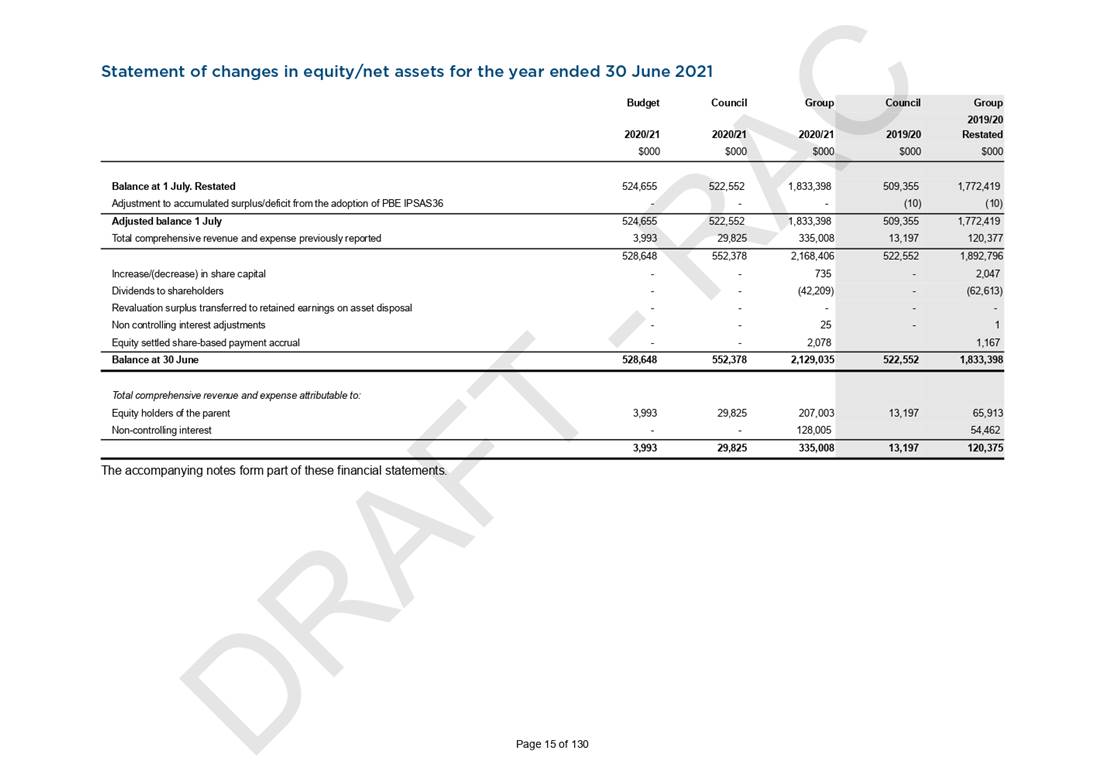
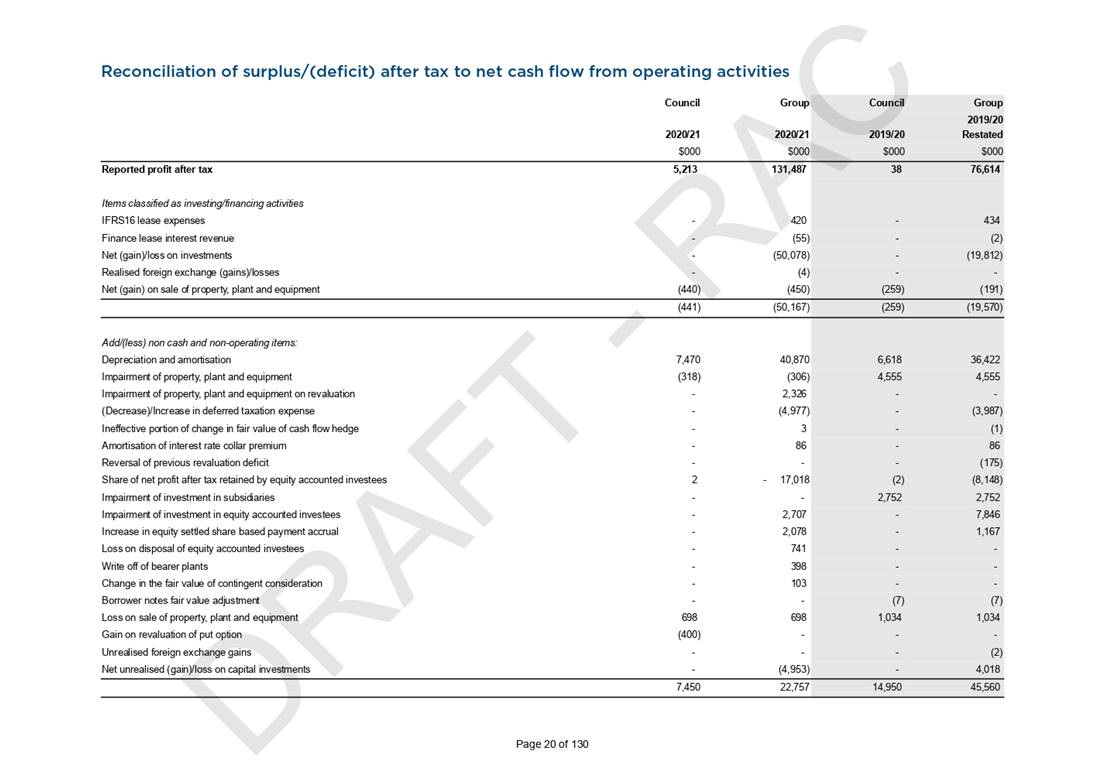
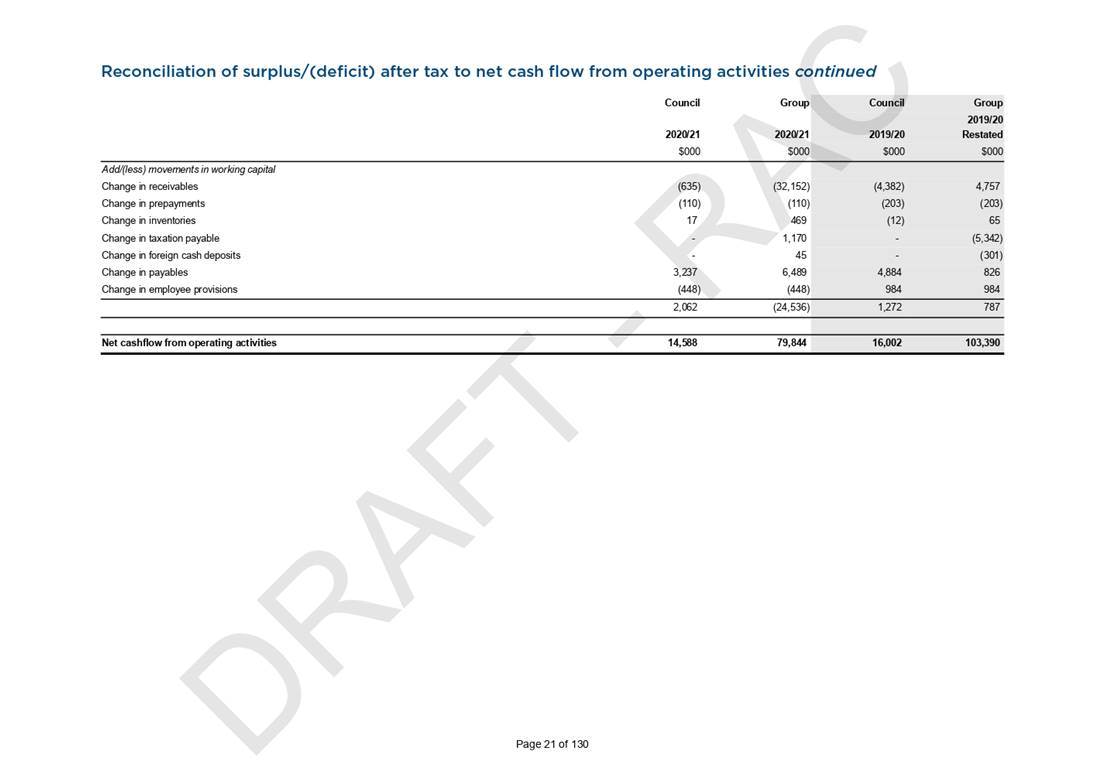
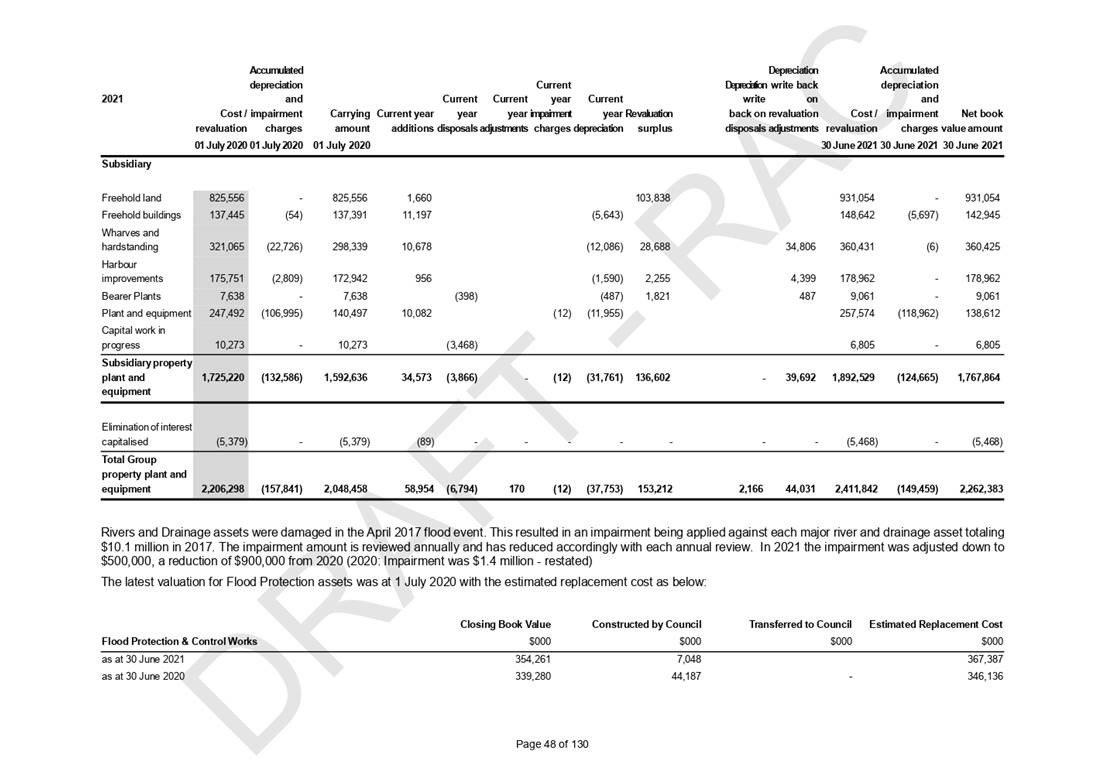
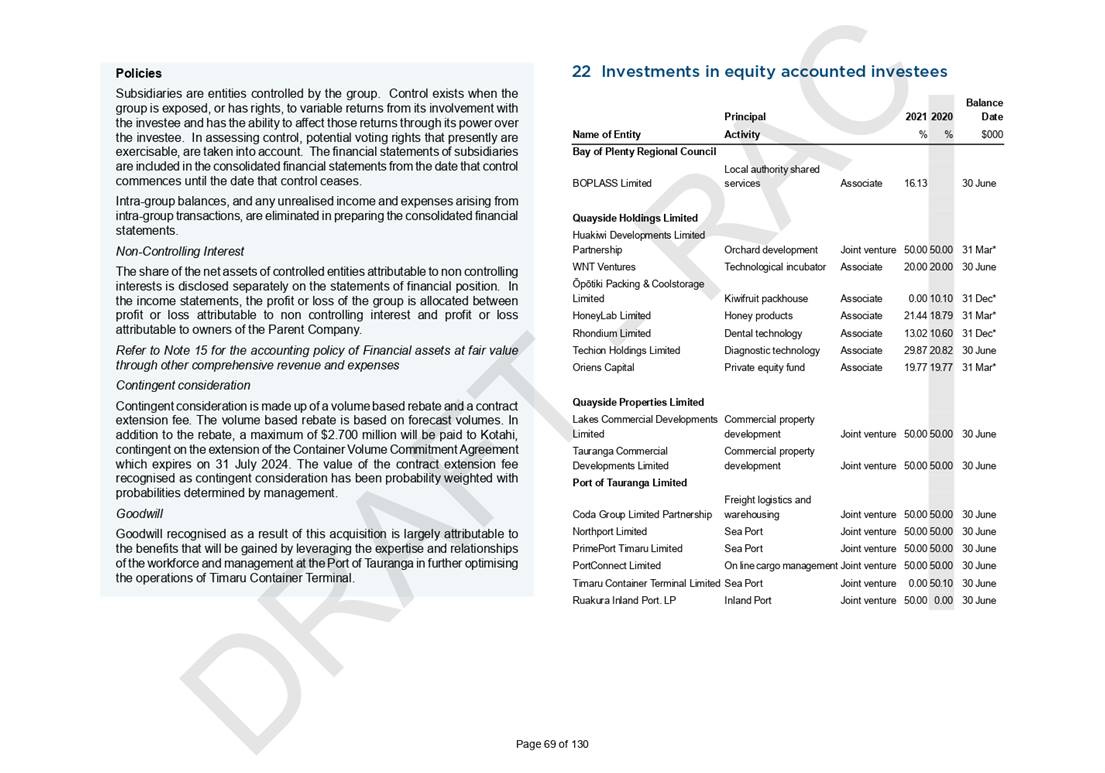
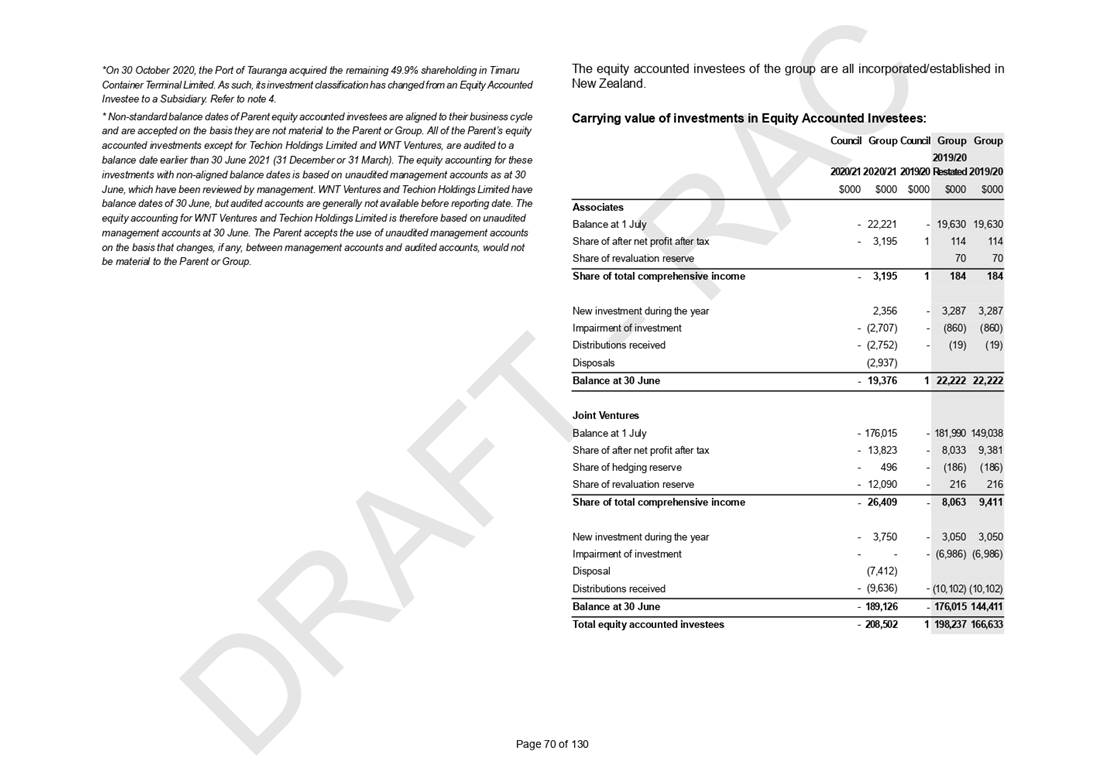
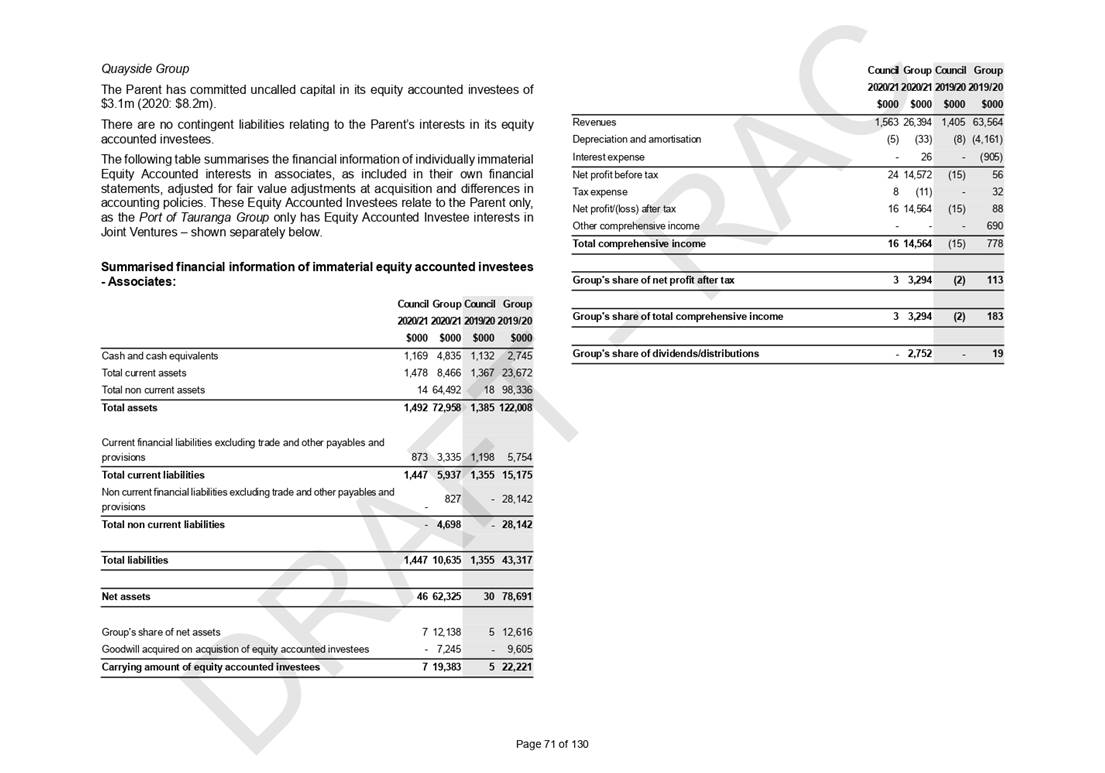
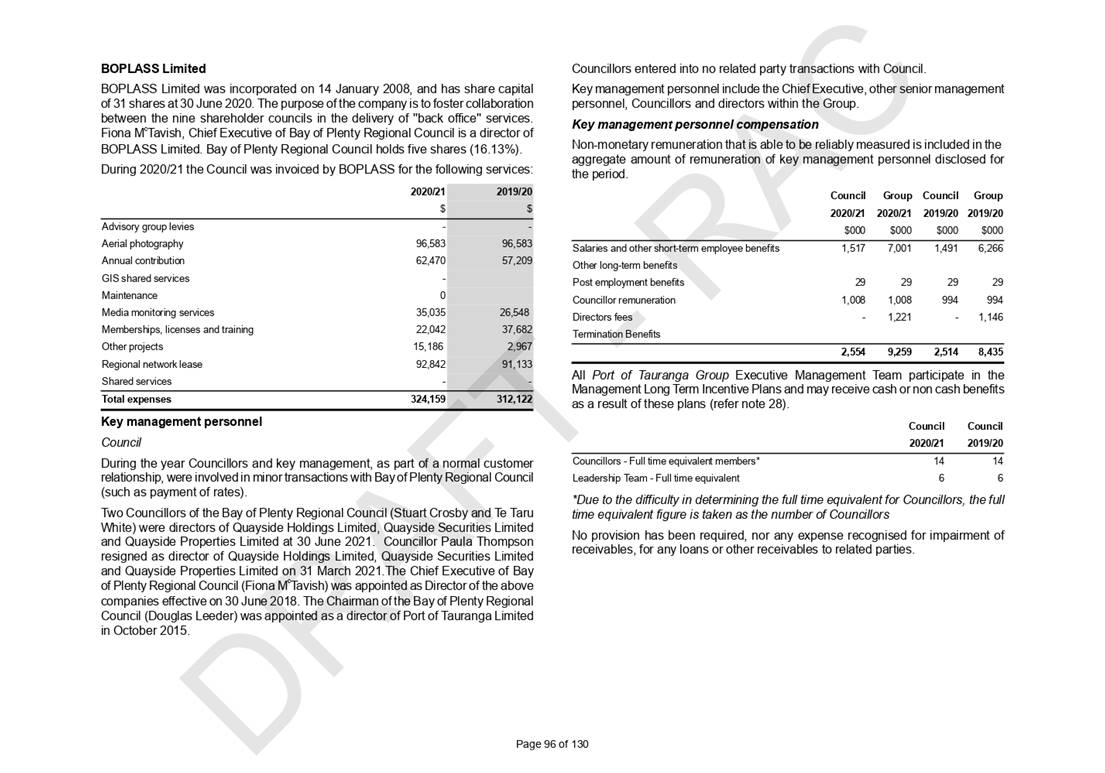
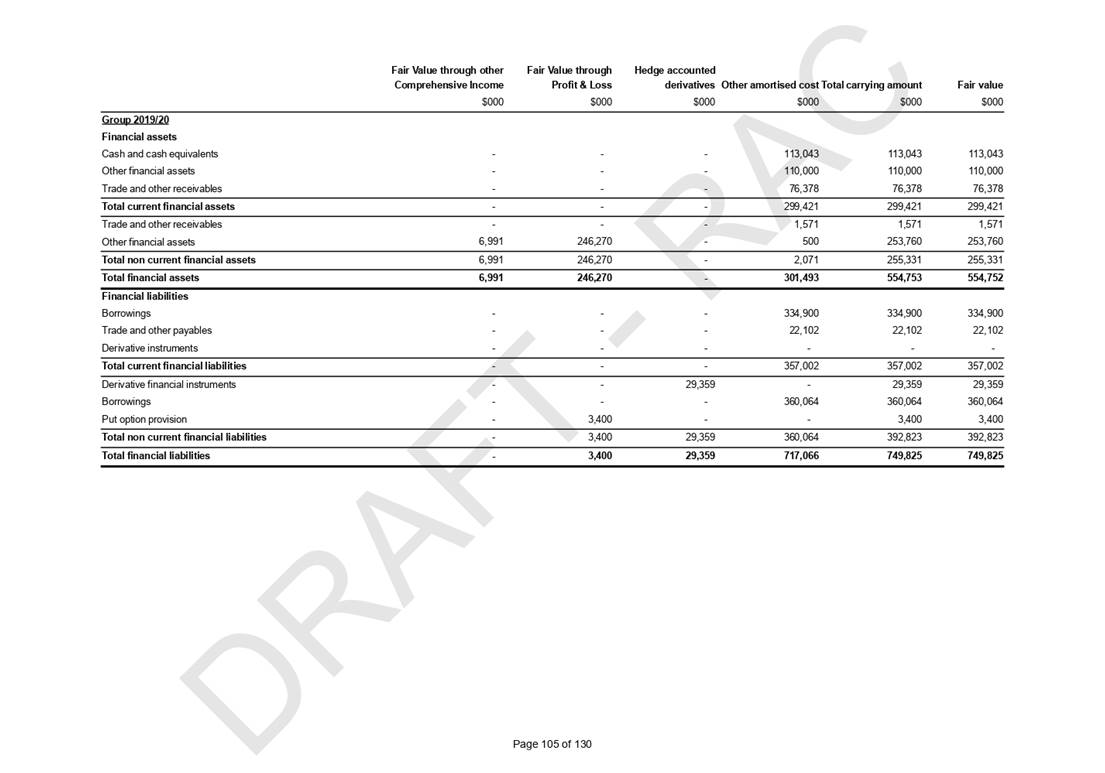
2.2.5 Council Group
The Draft
Annual Report 2020/21 contains both Council and Group results. Group results
include our 100 percent Council-owned subsidiary, Quayside Holdings Limited.
Quayside’s Annual Report 2020/21 was approved by its board of directors
in September 2021 and received by Council on 30 September 2021, along with the
annual report for the Toi Moana Trust and several Quayside subsidiaries.
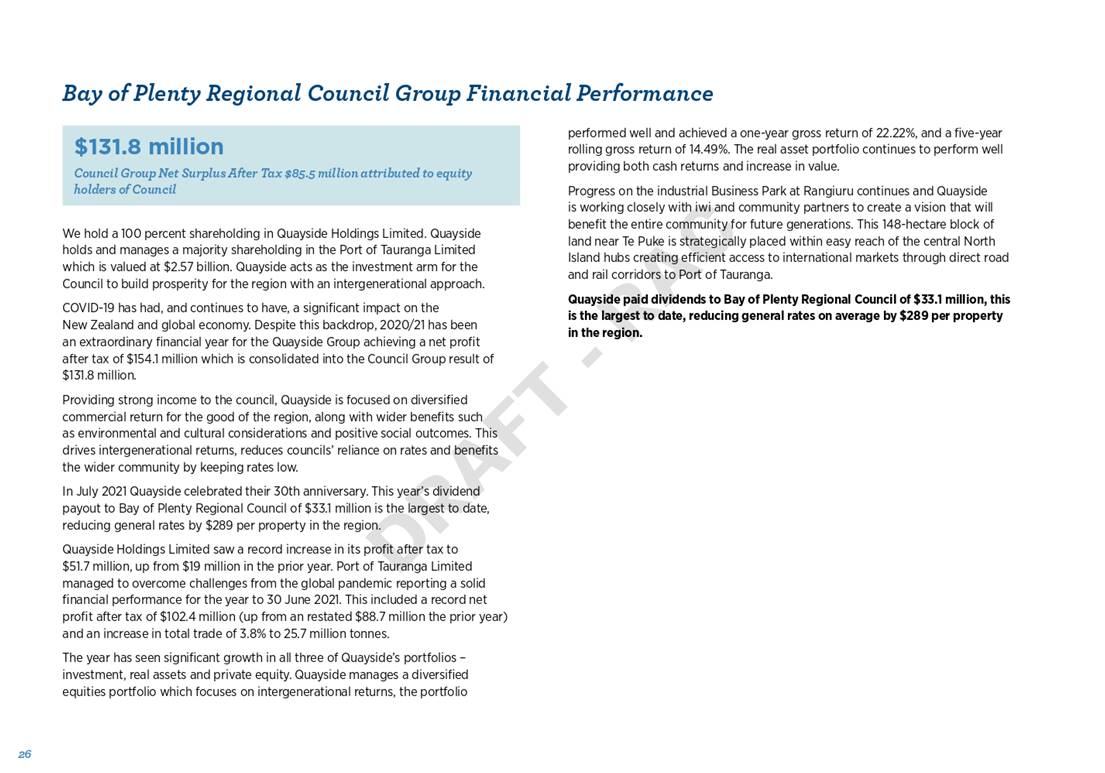
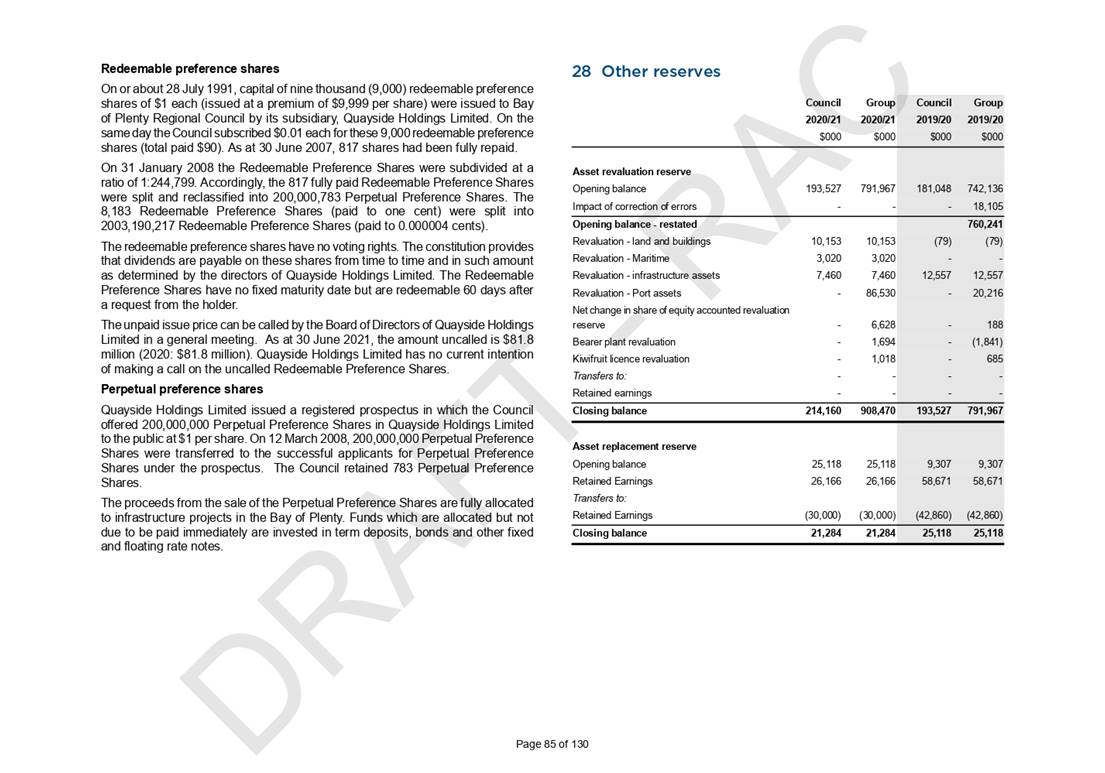
We hold a 100
percent shareholding in Quayside Holdings Limited. Quayside holds and manages a
majority shareholding in the Port of Tauranga Limited which is valued at $2.57
billion. Quayside acts as the investment arm for the Council to build
prosperity for the region with an intergenerational approach.
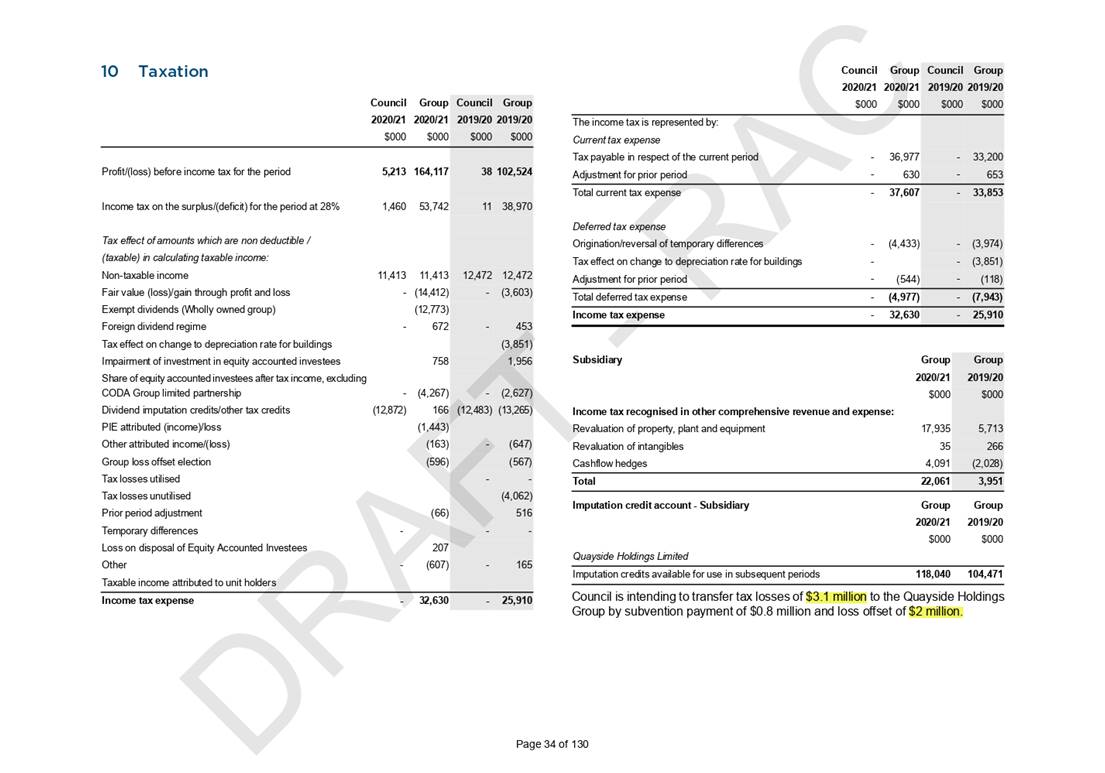
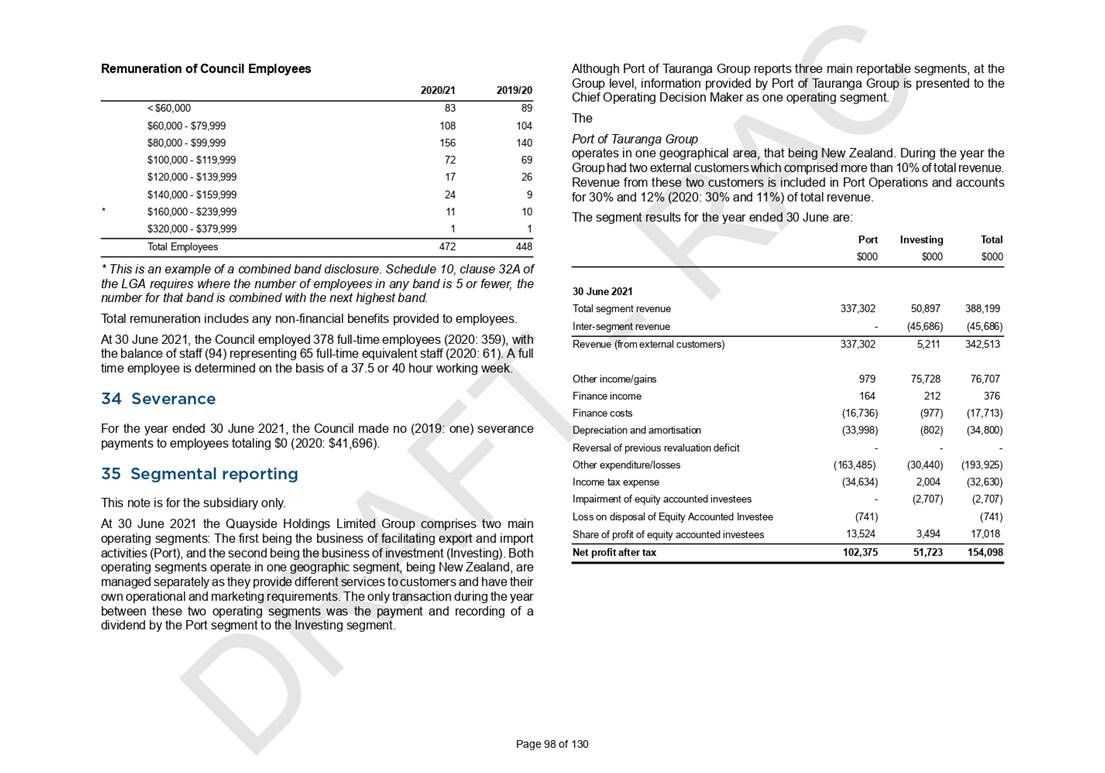
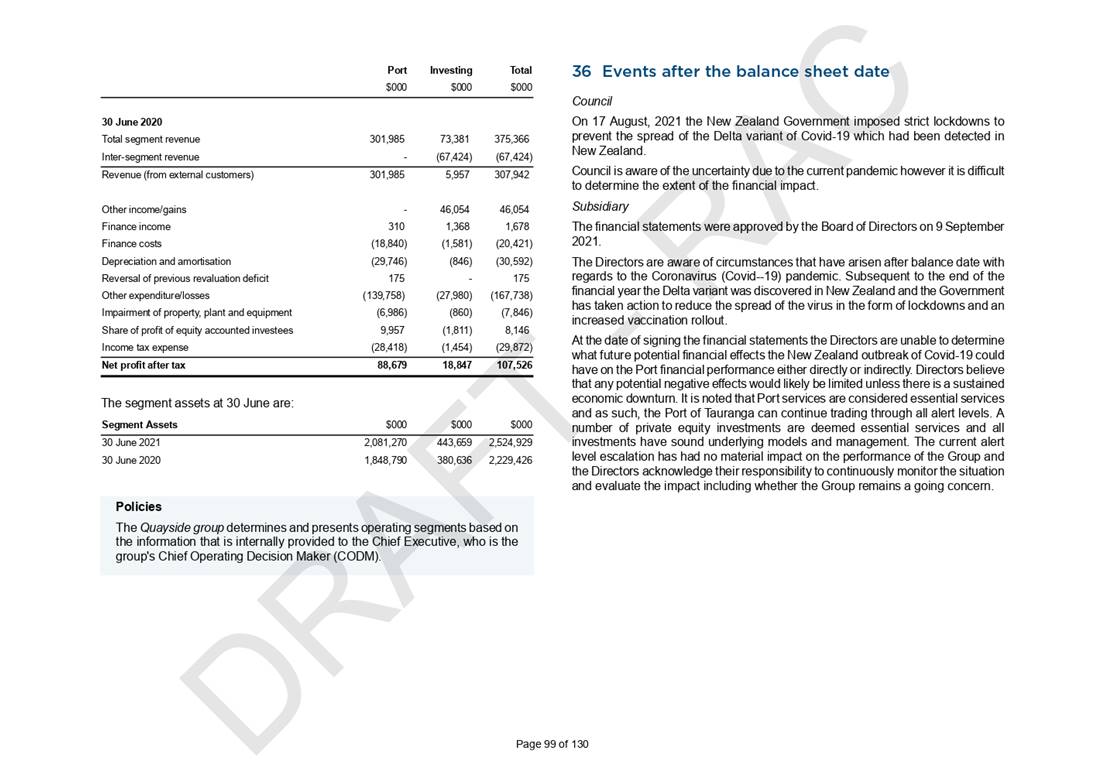
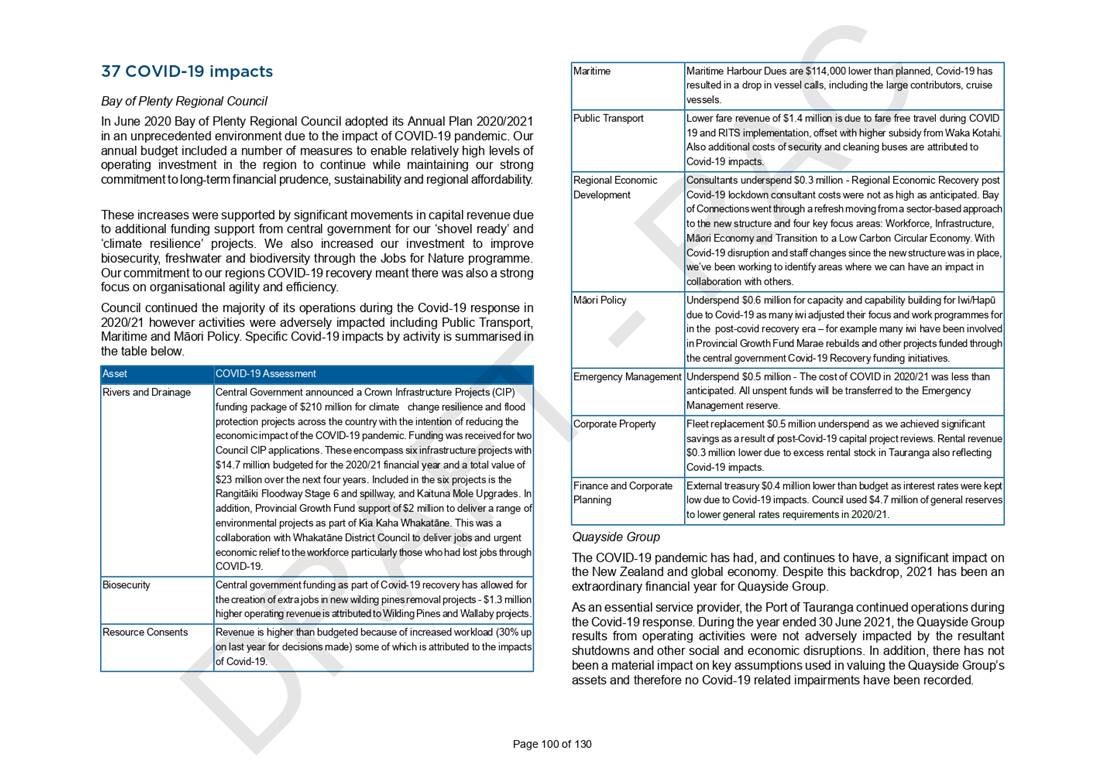
COVID-19 has
had, and continues to have, a significant impact on the New Zealand
and global economy. Despite this backdrop, 2020/21 has been an extraordinary
financial year for the Quayside Group achieving a net profit after tax of
$154.1 million which is consolidated into the Council Group draft net profit after
tax of $131.8 million, of which $85.5 million is attributed to equity holders /
Council.
This year’s dividend payout to Bay of Plenty
Regional Council of $33.1 million is the largest to date, reducing general
rates by $289 per property in the region. The Toi Moana Trust, which is an
investment fund managed by Quayside, also paid a dividend to Council of $2.25
million in 2020/21 in line with its Statement of Intent.
The approved
Annual Report 2020/21 for Quayside and Council’s subsidiaries can be
found on the Bay of Plenty Regional Council website.
3. Considerations
3.1 Risks and Mitigations
There are no direct risk
implications arising as a result of this report.
3.2 Climate Change
There are no direct climate
change implications arising as a result of this report.
Climate Change is identified as
a strategic challenge facing the Bay of Plenty Region. The Draft Annual
Report 2020/21 provides a report on the financial and non-financial performance
of Council this includes work delivered through Groups of Activities to
understand the implications of and to respond to the implications of Climate
Change.
3.3 Implications for
Māori
There are no direct implications
for Māori arising as a result of this report. The Draft Annual Report
2020/21 provides a report on the financial and non-financial performance of
Council. This includes reporting on work to support Māori participation in
Council decision-making processes.
3.4 Community Engagement
|
1.

|
Engagement with the community is not required as the
recommended proposal / decision relates to internal Council matters only.
|
3.5 Financial
Implications
This report and
the supporting documents highlight a strong financial performance by Council
despite the impacts of the Covid-19 pandemic on Council’s service delivery.
The majority of the capital budget underspend in 2020/21 has been carried
forward to future years through the Long Term Plan 2021-2031 process. As part
of the adoption of the Annual Report 2020/21 on 10 November 2021, Council will
be asked to approve further capital budget carry forwards from 2020/21 of
approximately $16 million of which $13 million is required in Draft Annual Plan
2022/23. Council has pre-funded its capital works programme through borrowings
from the Local Government Funding Agency. These figures will be confirmed once
the final audit is completed by Audit NZ.
4. Next Steps
At the time of
this report, the external audit of the Bay of Plenty Regional Council for the
year ended 30 June 2021 is currently being finalised and staff anticipate that
Council will receive verbal audit clearance from Audit New Zealand in early
November 2021. As such, some minor changes to the Draft Annual Report 2020/21
may be required. Further changes, for example rounding, may be made for
the final Annual Report. The final Annual Report for 2020/21 will be presented
for adoption by Council, at this stage, on 10 November 2021.
Attachments
Attachment 1 - BOPRC Draft Annual Report
2020/21 (Volume A) - RAC Review ⇩
Attachment 2 - BOPRC Draft Annual Report
2020/21 - Volume Two (Financials) - RAC Review ⇩